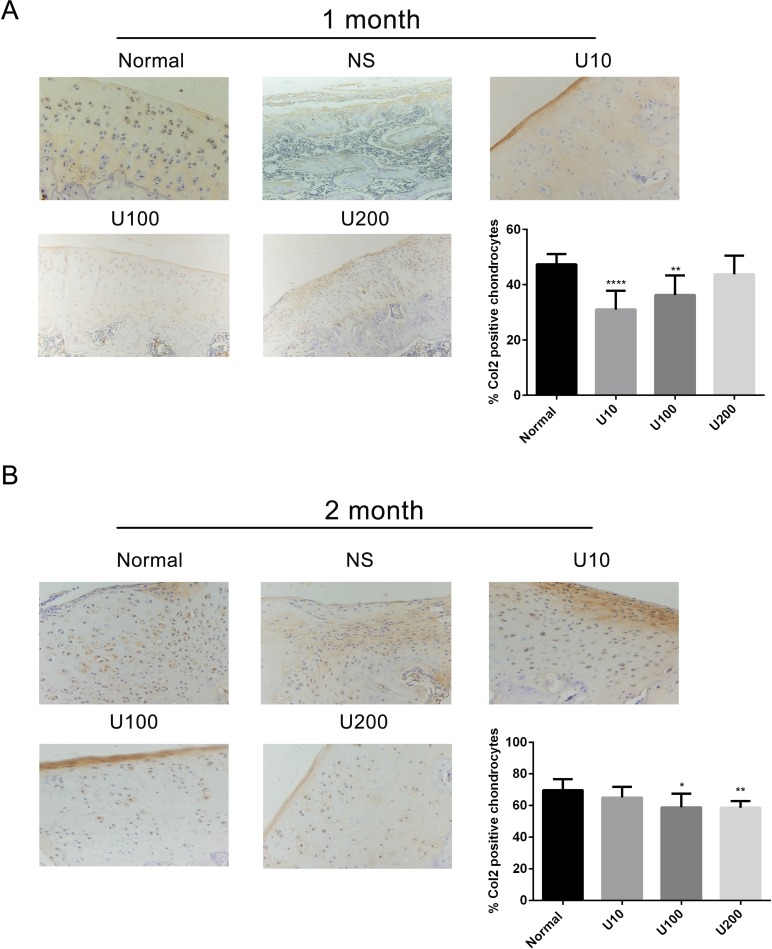
Figure 4. Effect of PLCγ1 inhibitor on Col 2 expression in a rat OA model.
Specimens were longitudinally cut into 3 μm sections and the levels of Aggrecan expression level were detected by immunohistochemisty technique (original magnification ×200). As described in Material and Methods, the positive chondrocytes were counted and analyzed using Image-Pro Plus 6.0 Software and GraphPad Prism version 5. (A) Representative images from rats treated by PLCγ1 inhibitor for 1 month after ACLT+MMx (original magnification ×200). Graph indicating the percentage of positive chondrocytes expressing Col2 (**P < 0.01,****P < 0.0001, vs normal group). (B) Representative images from rats treated by PLCγ1 inhibitor for 2 month after ACLT+MMx (original magnification ×200). Graph indicating the percentage of positive chondrocytes expressing Col 2 (*P < 0.05, **P < 0.01, vs normal group).

