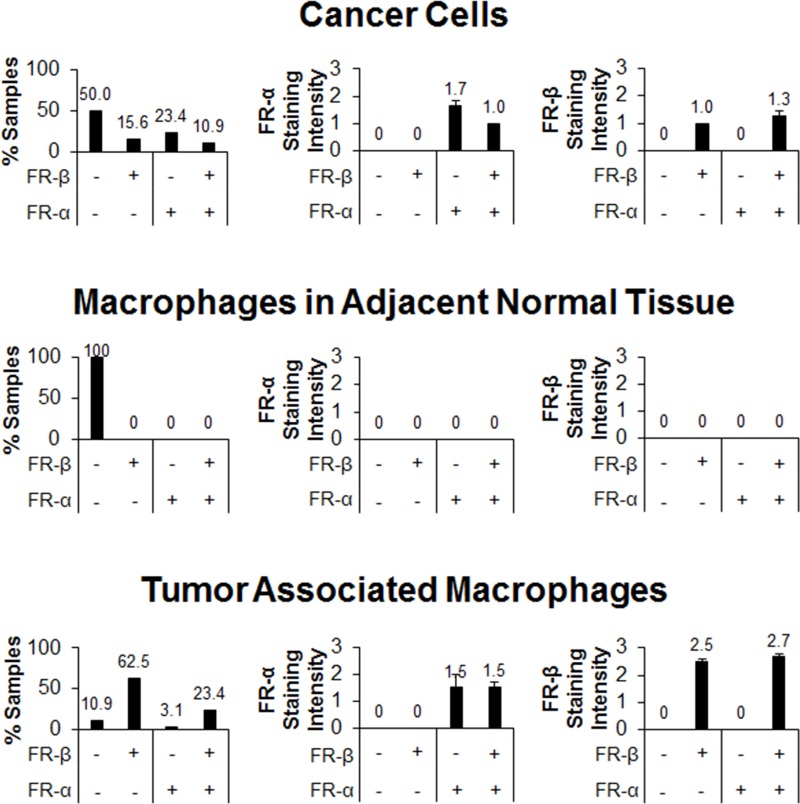
Figure 5. FR-α and FR-β expression in different cell populations within pancreatic cancer tissue samples.
Sequential sections were stained with mAb343 and m909. Staining of macrophages, normal cells, and cancer cells were graded on the same 0 to 3 scale (n = 64). The first column is a summary of the percentage of tissue sections that stained positive in each FR staining group (FR-α low/FR-β low, FR-α low/FR-β high, FR-α high/FR-β low, and FR-α high/FR-β high). The second and third columns show the average staining intensity of FR-α and FR-β, respectively, in each of the four staining groups (error bars represent SEM).

