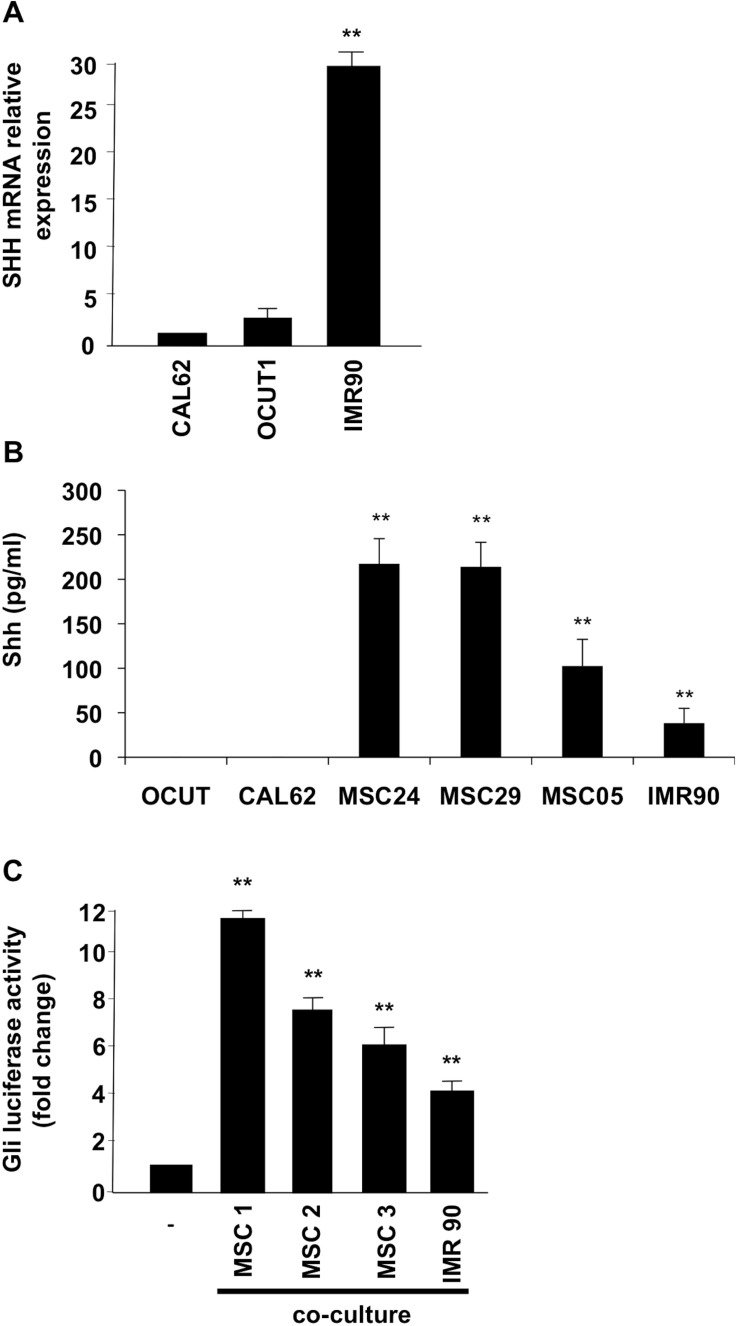
Figure 5. Stromal cells produce Shh ligand and induce signaling activation in ATC cells.
(A) Shh mRNA expression levels were evaluated by Q-RT-PCR in CAL62, OCUT1 and IMR90 cells. (B) Elisa assay was performed on the supernatant of thyroid and stromal cells to measure the Shh production. Error bars represent standard deviations of experimental triplicates. (C) 3 × 10⁴ Cal62 cells were plated on cover glass and transfected with Gli-Luc reporter (pGL3-Gli-Luc). After 24 hours cells cover glasses were put in co-culture with mesenchymal cells (MSC) or IMR90 fibroblasts for 24 hours. Shh pathway activation was evaluated by Luciferase assay. Error bars represent standard deviations of different experiments. **p = ≤ 0.01; *p = ≤ 0.05.

