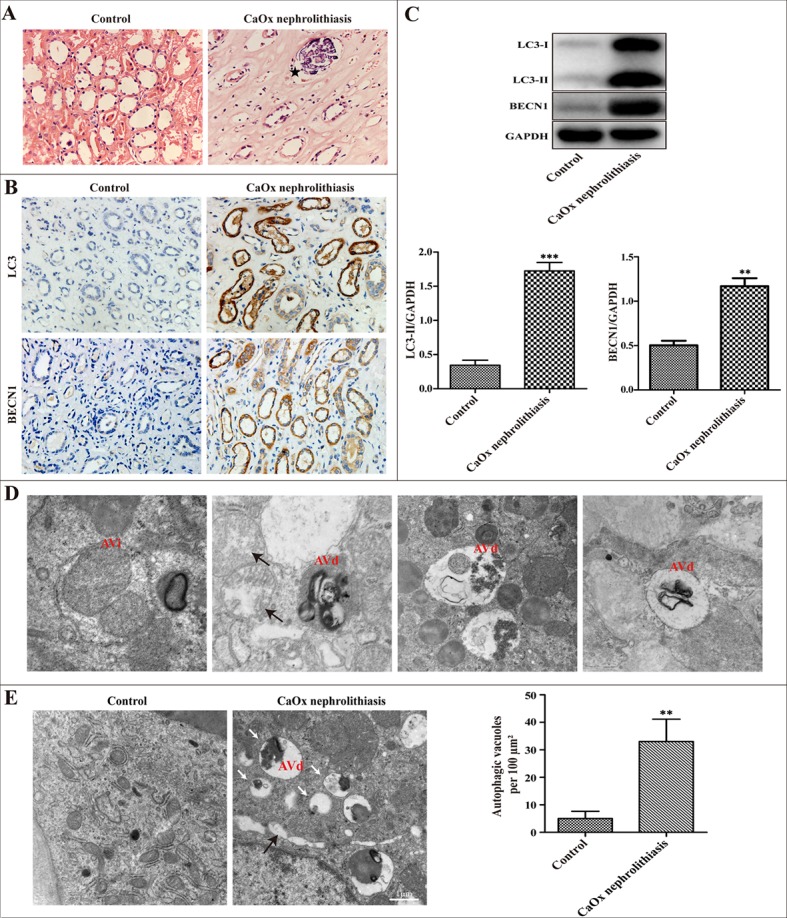
Figure 1. Autophagic activity is increased in the kidney of CaOx nephrolithiasis patients.

(A) Representative images of H&E staining showed crystal deposition in the lumens of the renal tubules of CaOx nephrolithiasis patients (black asterisk); scale bar: 50 μm. (B) Immunohistochemical analysis of LC3 and BECN1 expression in CaOx nephrolithiasis tissues and the controls; scale bar: 50 μm. (C) A representative immunoblot and quantification analysis of LC3-II and BECN1 in CaOx nephrolithiasis tissues and the controls. (D and E) Representative transmission electronic micrographs showing autophagic vacuoles in CaOx nephrolithiasis patients and the controls. TEM images showed a typical initial autophagic vacuoles (AVi) and late/degradative autophagic vacuoles (AVd). Mitochondria were swollen and damaged in CaOx nephrolithiasis patients (black arrows) (D); scale bar: 500 nm. The number of autophagic vacuoles per 100 μm2 was determined in transmission electron micrographs. White arrows indicated autophagic vacuoles (E); scale bar: 1 μm. Data are presented as the mean ± SD from three experiments. **P < 0.01, ***P < 0.001 versus the control group.
