
Figure 3. ROS mediates CaOx crystal-induced autophagy in HK-2 cells.
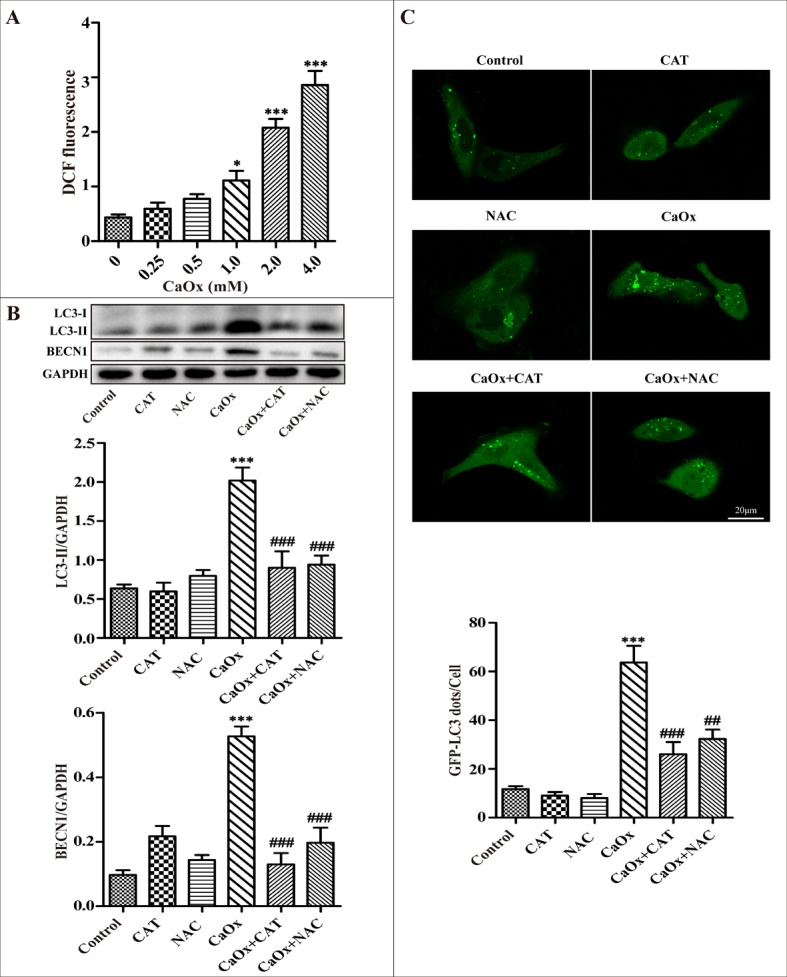
(A) Intracellular production of ROS was measured using a fluorescence spectrometer after HK-2 cells were treated with various concentrations of CaOx crystals. (B) A representative immunoblot and quantification analysis of LC3-II and BECN1 as assayed after exposure to vehicle or CaOx crystals (4 mM) in the absence or presence of catalase (CAT, 2000 U/ml) or NAC (5 mM) for 24 h. (C) The formation of GFP-LC3 dots was analyzed using confocal microscopy after exposure to vehicle or CaOx crystals (4 mM) in the absence or presence of catalase (CAT, 2000 U/ml) or NAC (5 mM) for 24 h. GFP-LC3 dots/cell were quantified; scale bar: 20 μm. Data are presented as the mean ± SD from three experiments. *P < 0.05, ***P < 0.001 versus the control group, ##P < 0.01, ###P < 0.001 versus the CaOx (4 mM) group.