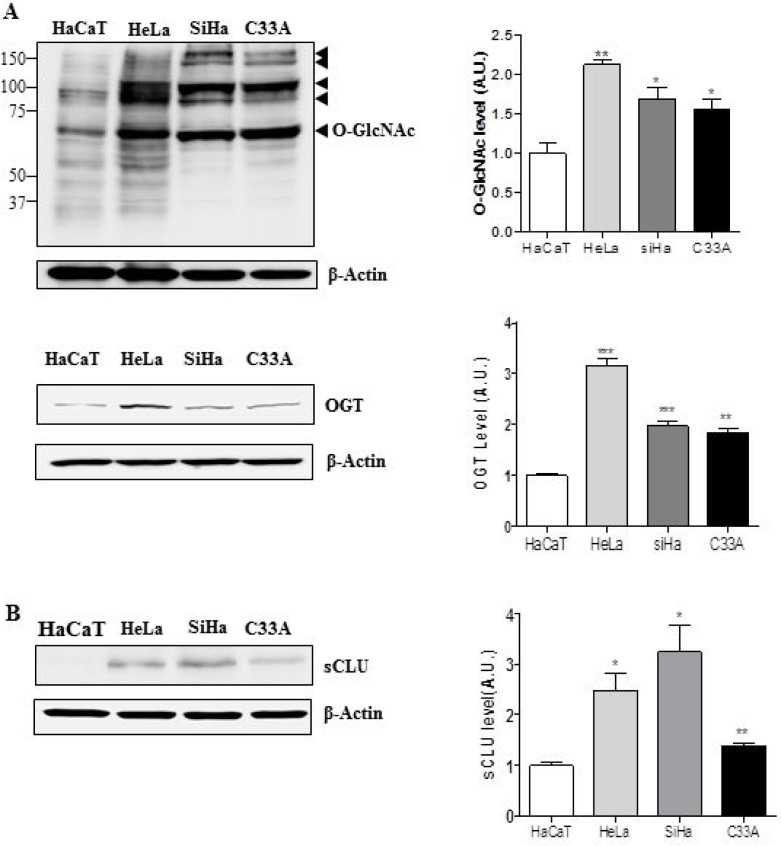
Figure 1. Expression of sCLU, O-GlcNAc, and OGT is elevated in cervical cancer cells.
Expression of O-GlcNAc, OGT (A), and sCLU (B) was analysed by western blot in cervical cancer cell lines (HeLa, SiHa, and C33A) and normal keratinocytes (HaCaT). Black arrowheads indicate the specific signals for each protein. Blots were reprobed for β-actin to ensure equivalent loading; quantification of each band was normalized to the β-actin signal. Data are presented as mean ± S.E.M. (n = 3). *p < 0.05 and **p < 0.01 relative to levels in HaCaT cells.

