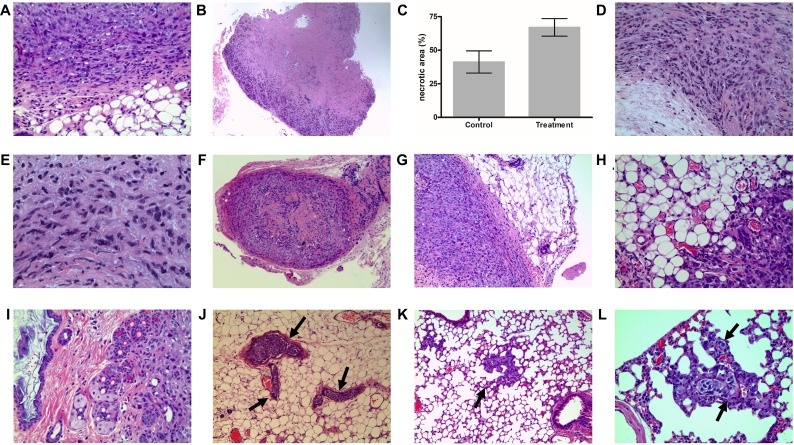
Figure 2. Xenograft tumor tissue H&E staining.
(A) Pretreatment tumors showed classic RCC morphology with rounded cells and occasional clearing of cytoplasm. (B) Large areas of necrosis were observed in sunitinib-sensitive tumor. (C) A bar graph comparing percentage areas of necorsis in sunitinib-treated vs. control xenografts. (D) Sarcomatoid phenotype with spindle cells was observed in resistant tumors. (E) Poorly differentiated cells were also seen in resistant tumors. (F) Low power magnification showing sensitive tumor with well-circumscribed border, fibrosis and chronic inflammatory infilitrate in the capsule. (G) Higher magnification showing pushing borders with fibrosis and inflammation in sunitinib-sensitive tumors. (H) Irregular infiltrative tumor margins with fat invasion were seen in sunitinib-resistant tumors (I) Resistant tumors were more aggressive with invasion to adjacent organs (skin dermis in this case). (J) Resistant tumors showed extensive vascular invasion (vessels indicated by arrows). (K) Lung metastasis in resistant tumors (arrow). Metatatsis showed vascular co-option pattern. (L) Vascular-co-option (arrow) in resistant tumor metastasis. Tumors travel along blood vessels of the wall of the alveoli while preserving the alveolar spaces.

