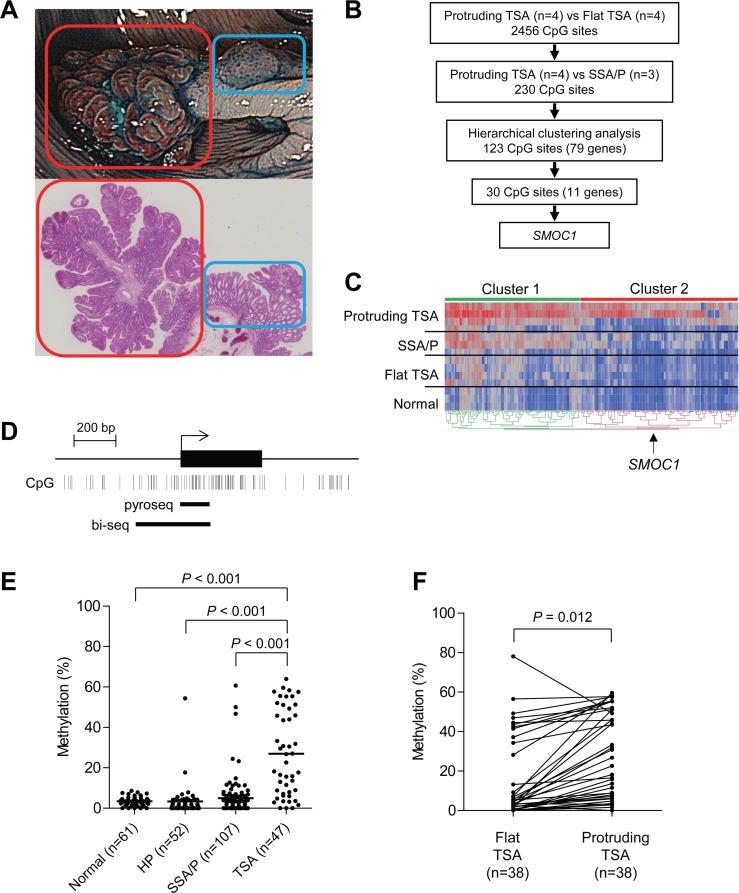
Figure 1. Identification of DNA methylation associated with the development of TSAs.
(A) Representative example of TSA. An endoscopic view is shown on the top and a histological view is below. Red boxes indicate a protruding component and blue boxes indicate a flat component. (B) Workflow to identify DNA methylation in TSAs. (C) Heatmap of the selected 230 CpG sites within the protruding components of TSAs (n = 4), SSA/Ps (n = 3), flat components of TSAs (n = 4) and normal colonic tissue (n = 3). Clusters 1 and 2 include 107 and 123 CpG sites, respectively. (D) Diagram of the promoter region of SMOC1. The transcription start site and exon 1 are shown on the top, and the regions analyzed using bisulfite pyrosequencing and bisulfite sequencing are shown below. (E) Summarized results of bisulfite pyrosequencing of SMOC1 in specimens from the indicated lesions and adjacent normal colonic tissues. (F) Results of bisulfite pyrosequencing of SMOC1 in specimens from TSAs consisting of protruding and flat components.

