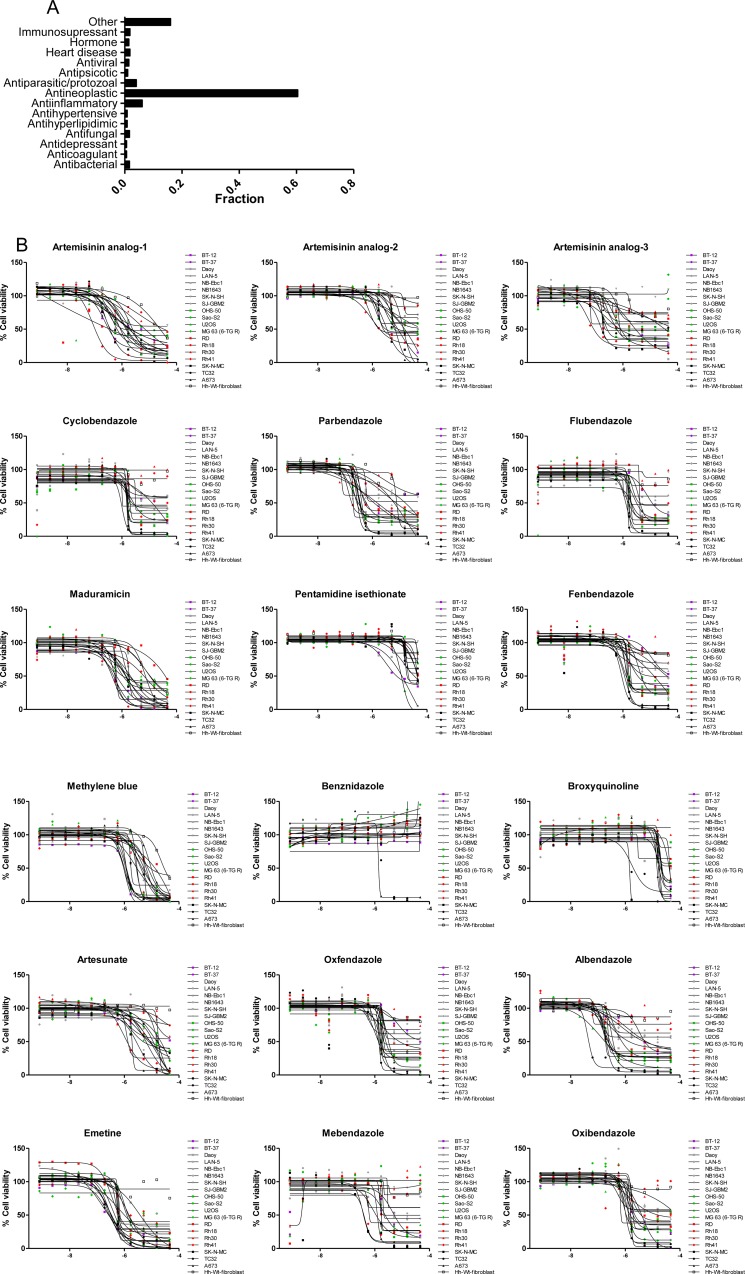
Figure 3. Indication of active compounds identified in the follow-up screen.
(A) Fraction of compounds that are active against one or more cell line. The category labeled as “Other” contains indications represented by 1 compound. (B) Dose response of active antiparasitic/protozoal agents. X-axis represents Log[M].

