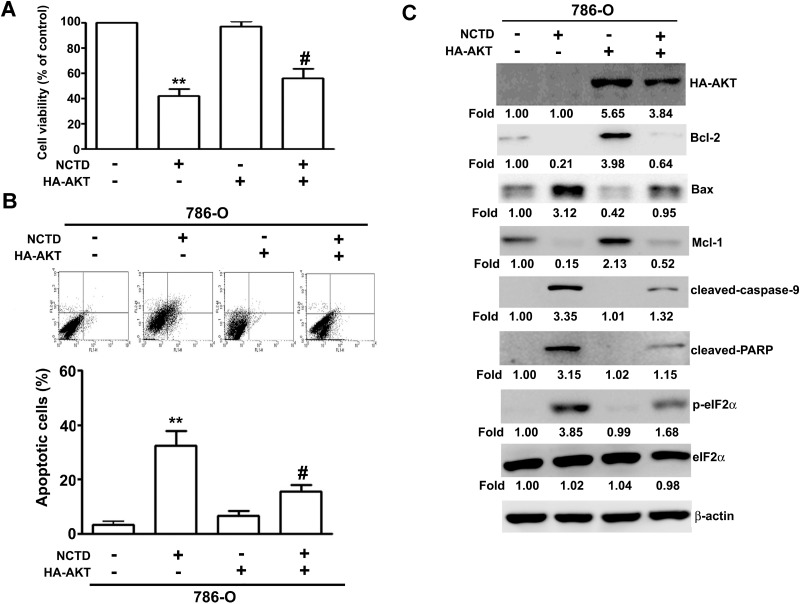
Figure 7. NCTD induces apoptosis through inactivation of AKT expression.
Transfection of Neo or HA-AKT plasmid in 786-O cells for 48 h, then followed by NCTD (40 μM) for another 24 h. (A) The cell viability was measured by MTT assay. (B) Apoptotic cells were detected by the Annexin-V and PI double-stained flow cytometry. (C) The expression of Bcl-2, Bax, Mcl-1, cleaved-caspase-9, cleaved-PARP, p-eIF2α and eIF2α were assessed by western blot. All data are represented as mean ± SEM (n = 3) for each group. **p < 0.01 compared with control.

