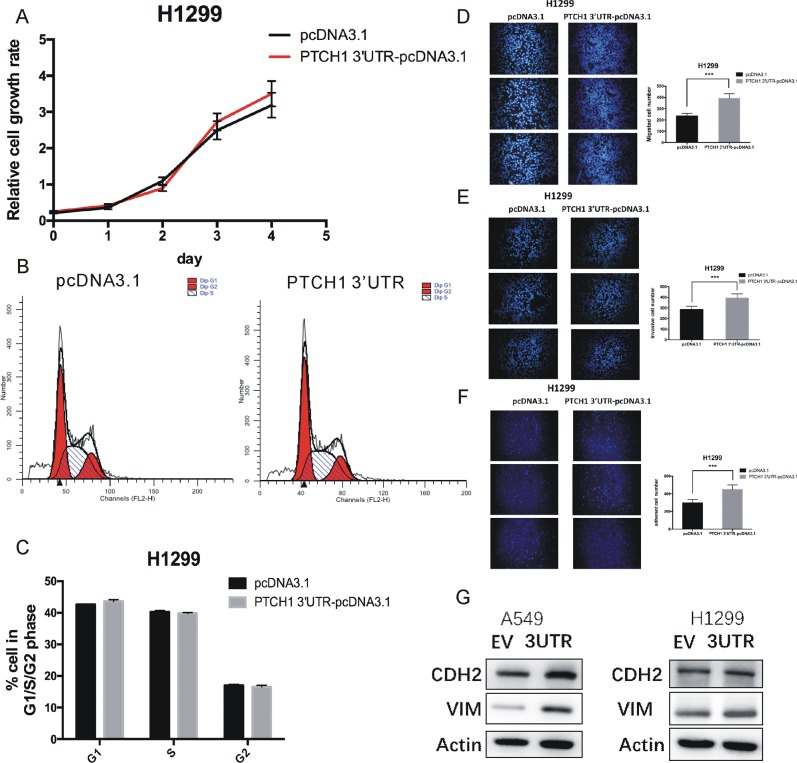
Figure 1. Overexpression of PTCH1 3’UTR promotes cell migration, invasion and adhesion in H1299.
(A) Cell proliferation analysis was performed with CCK-8 assay in H1299 cells. Cells transfected with PTCH1 3’UTR or pcDNA 3.1 vector were seeded into 96-well plate at 5000 cells/well and examined at time points of 0h, 24h, 48h, 72 h and 96h. Overexpression of PTCH1 3’UTR had no significant difference with that transfected with pcDNA3.1. (B-C) Cell cycle assay was performed in H1299 cells. Cells were transfected with PTCH1 3’UTR or pcDNA 3.1 vector for 48 h, stained with PI and evaluated with a FACScalibur flow cytometer. Overexpression of PTCH1 3’UTR had almost the same population of cells in the G1 (resting), S (synthesis) and G2 (mitotic) phases with negative control. (D-F) Migrations, invasion and adhesion assay were performed in H1299 cells. Cells were transfected with PTCH1 3’UTR or control and seeded into the upper chamber of a transwell to count by transwell assay. Overexpression of PTCH1 3’UTR promotes cell migration, invasion and adhesion compared with negative control. Data are presented as the mean ± SD (n = 3). Significance was defined as p<0.05 (*, p < 0.05; **, p < 0.01; ***, p < 0.001). (G) Effect of PTCH1 3’UTR on the protein expression levels of CDH2 and VIM in A549 and H1299 cells using western blot analysis. β-actin was used as internal control.

