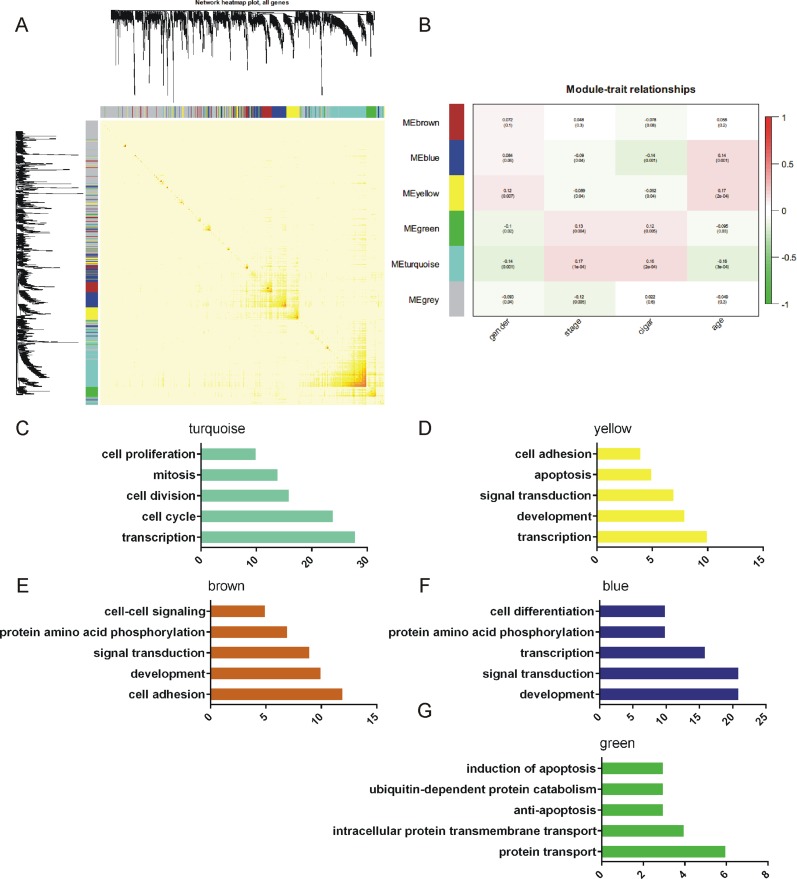
Figure 3. Construction of the gene co-expression network.
GO analysis of these modules. (A) Construction of the gene co-expression network. Each color represents a certain gene module. (B) The association between each module and the clinical character. The resulting module-clinic correlation was visualized as a heatmap in (B). (C-G) Top 5 of biological processes in GO analysis of turquoise (C), yellow (D), brown (E), blue (F), and green (G) module.

