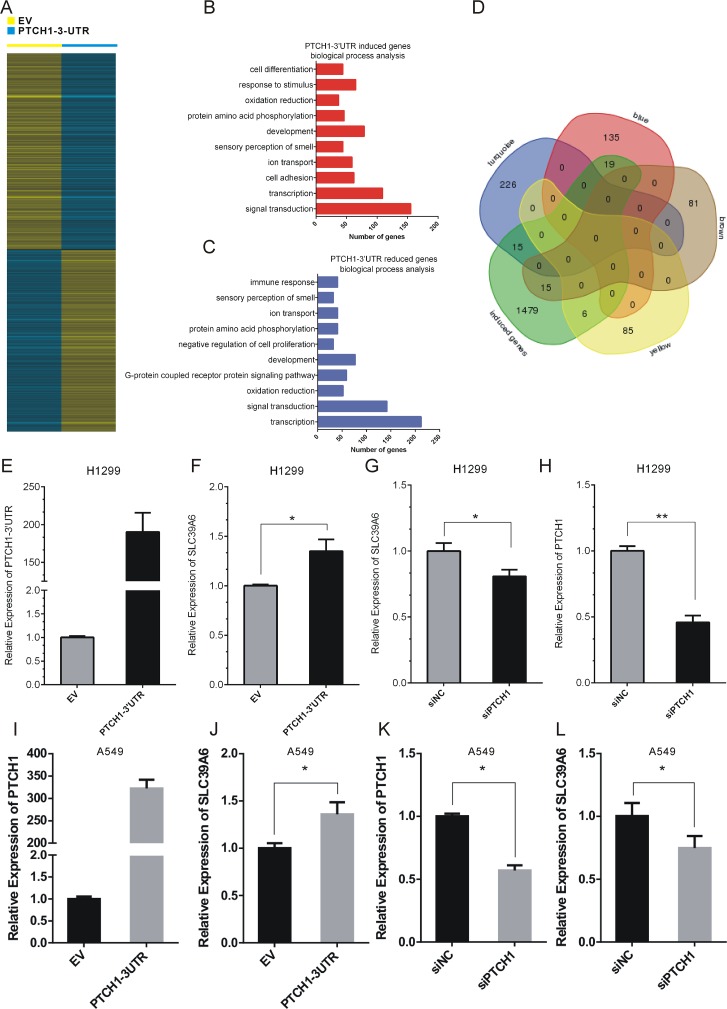
Figure 4. PTCH1 3’UTR up-regulated SLC39A6 expression in NSCLC cells.
(A) Identification of PTCH1 3’UTR regulated genes in H1299 cells. (B-C) GO analysis of up-regulated transcripts (B) and down-regulated (C) transcripts of PTCH1 3’UTR. Number of genes is indicated at x-axis. Up-regulated genes were enriched in the biological processes of signal transduction, cell adhesion and cell differentiation. Down-regulated genes were enriched in the biological processes of transcription, signal transduction and development. (D) Venn diagrams for combing the PTCH1 3’UTR inducing genes with previous module genes. 15 percent of genes in brown modules (15/96) were up-regulated after overexpressing PTCH1 3’UTR. (E-H) RT-PCR analysis of SLC39A6 and PTCH1 expression level after overexpression PTCH1-3’UTR or silencing PTCH1 in H1299 cells. (I-L) RT-PCR analysis of SLC39A6 and PTCH1 expression level after overexpression PTCH1-3’UTR or silencing PTCH1 in A549 cells. Data are presented as the mean ± SD (n = 3). Significance was defined as p<0.05 (*, p < 0.05; **, p < 0.01; ***, p < 0.001).

