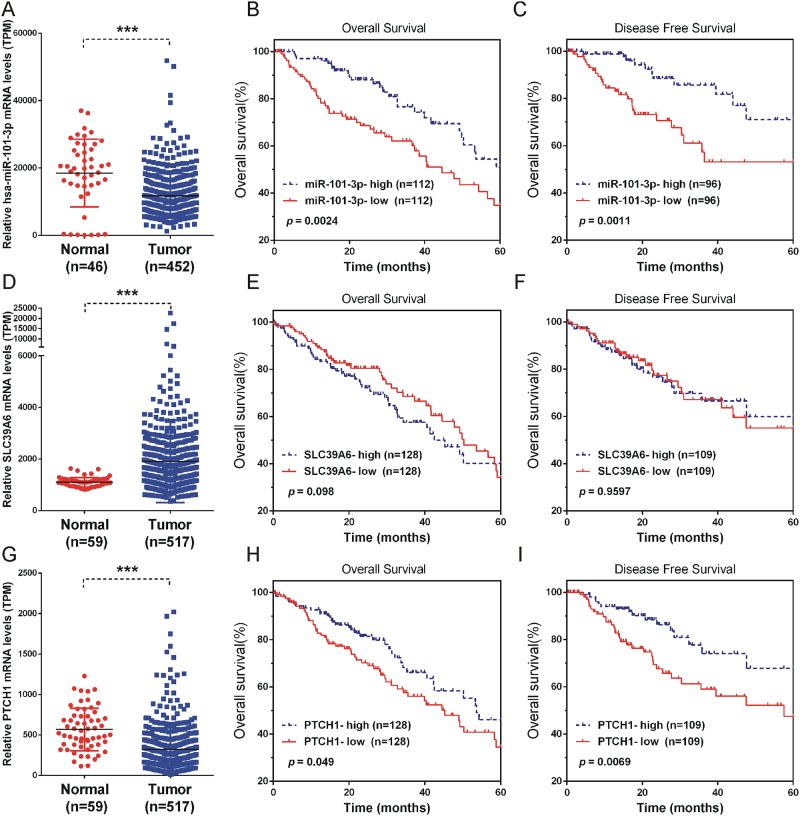
Figure 8. Low miR-101-3p and PTCH1 and high SLC39A6 levels were positively correlated with NSCLC progression.
(A, D, G) The expression of miR-101-3p, SLC39A6 and PTCH1 in NSCLC samples (n=452) compared to normal tissues (n=46). (B, C, E, F, H and I) Kaplan-Meier curves for survival time and disease-free survival time in patients with non-small cell lung cancer according to expression of miR-101-3p (B-C), SLC39A6(E-F), PTCH1 (H-I). Significance was defined as p<0.05 (*, p < 0.05; **, p < 0.01; ***, p < 0.001).

