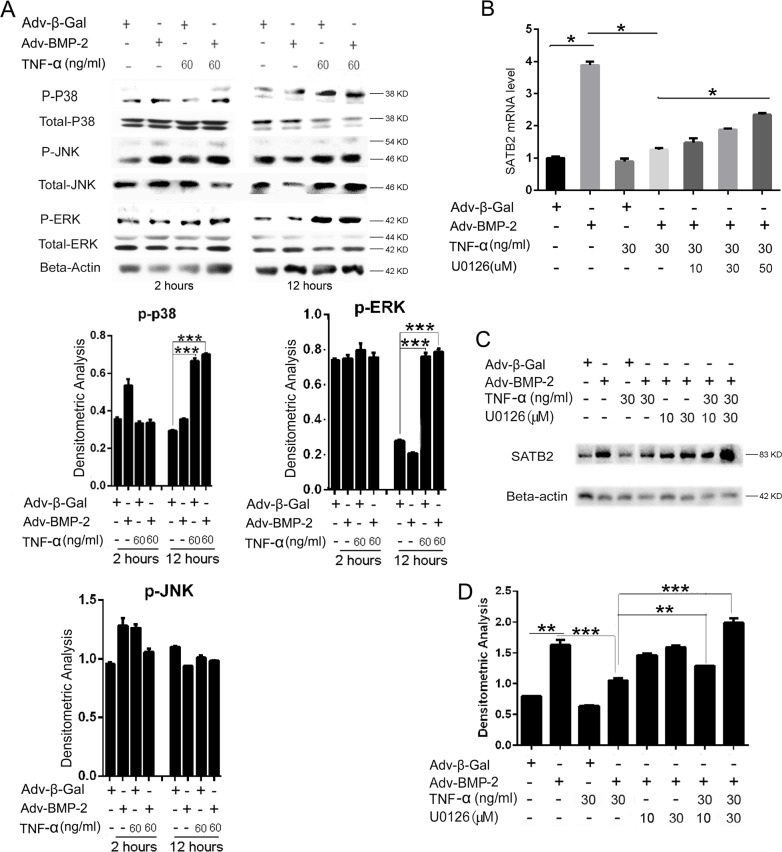
Figure 5. TNF-α inhibits SATB2 expression by activating the MAPK-ERK signaling pathway.
(A) The C2C12 cells were treated with Adv-β-Gal (150 pfu/cell), Adv-BMP2 (150 pfu/cell), or 60 ng/mL of TNF-α for 2 or 12 h. Cell lysates were used to analyze p-ERK, p-p38, and p-JNK activation. The total-ERK, total-p38, and total-JNK were used as loading controls, respectively. The relative densitometric analysis of p-p38, p-ERK and p-JNK were shown. These western blot images were uncropped. (B, C) The C2C12 cells were treated with Adv-β-Gal (150 pfu/cell), Adv-BMP2 (150 pfu/cell), 30 ng/mL of TNF-α or 10 μM to 50 μM of U0126 for 72 h. The SATB2 expression level was detected by real-time PCR (B) and western blotting (C). (D) Densitometric analysis of C. The data are presented as mean ± S.D. (n = 3; *p < 0.05; **p < 0.01; ***p < 0.001). Uncropped western blot images corresponding to Figure 5C was shown in Supplementary Figure 3.

