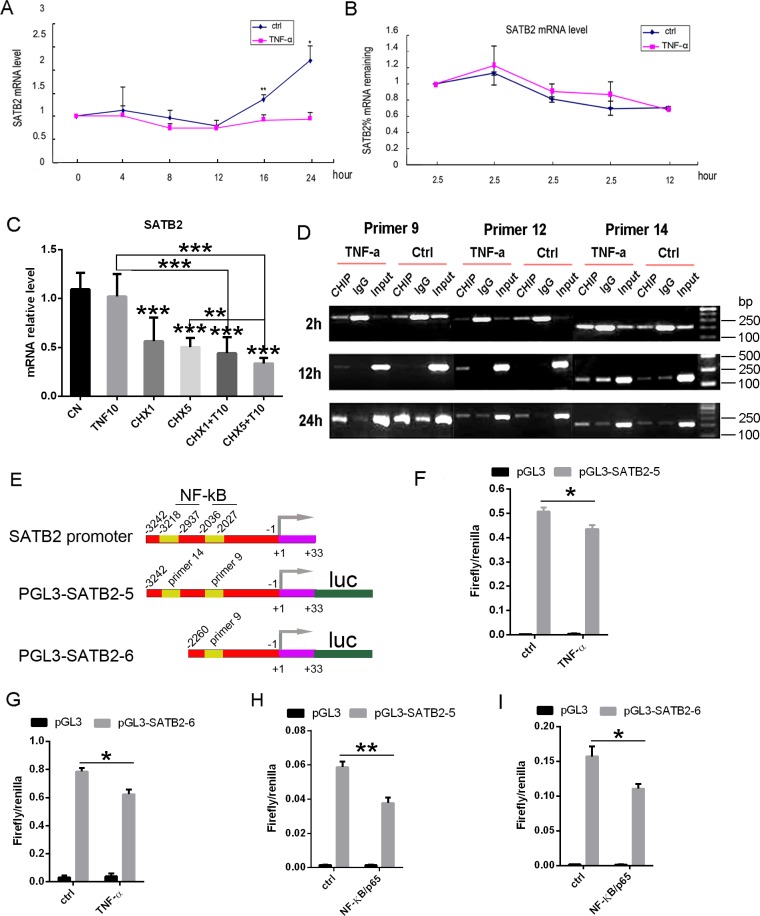
Figure 7. TNF-α induced NF-κB directly interacts with SATB2 gene promoter to inhibit its expression.
(A) Time course of TNF-α action. C2C12 cells were treated with BMP2 and with or without TNF-a (10ng/ml) for indicated times, SATB2 mRNA was measured by real time RT-PCR. (B) SATB2 mRNA stability was not changed by TNF-α. C2C12 cells were treated with BMP2 (150ng/ml) for one day and then treated with actinomycin D (0.5ug/ml) 2 hours before TNF-a (10ng/ml) were added, followed by detecting SATB2 mRNA relative levels at indicated time. (C) New protein synthesis is not required for TNF-α inhibition of SATB2 expression. Cycloheximide (CHX) (1 ug/ml, 5 ug/ml) was added 2 h prior to TNF-α (10 ng/ml, 20 ng/ml). SATB2 mRNA was measured 24 h after the addition of TNF-α. (D) C2C12 cells were treated with Adv-BMP2 and 10ng/ml TNF-α for indicated times and CHIP assay were performed with NF-kB/P65 antibody, followed by PCR with indicated primers. The gels have been run under the same experimental conditions. Uncropped images corresponding to Figure 7D were shown in Supplementary Figure 5. (E) NF-κB associate sites on SATB2 promoter and the schema of luciferase reporter gene plasmids construction. (F, G, H, I) Luciferase assay. Luciferase assay with plasmid pGL3-SATB2-5 (F) or pGL3-SATB2-6 (G) and treated with TNF-α. Luciferase assay with plasmid pGL3-SATB2-5 (H) or pGL3-SATB2-6 (I) and combined with NF-κB/p65 over-expression. The data are presented as mean ± S.D. (n =3; *p < 0.05. **p < 0.001, ***p < 0.0001).

