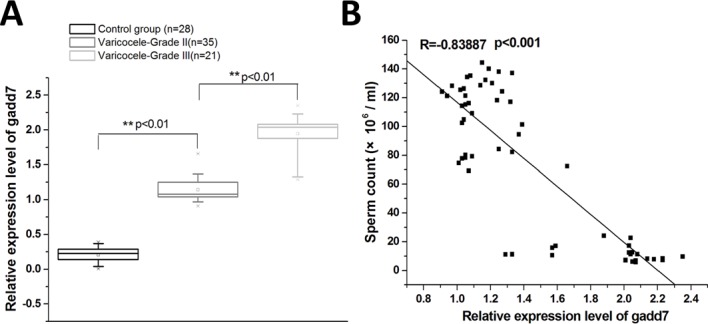
Figure 1. The expression of gadd7 in varicocele and healthy control groups.

The relative gadd7 expression levels were determined using Real-Time qPCR. GAPDH was used as an internal control. (A) qRT-PCR analysis of the expression of gadd7 in the ejaculated spermatozoa of varicocele groups or the healthy control. The expression differences were analyzed using independent samples t-test. (B) The relative expression level of gadd7 was negatively correlated with the sperm count. Pearson's coefficient correlation was used for expression correlation assay.
