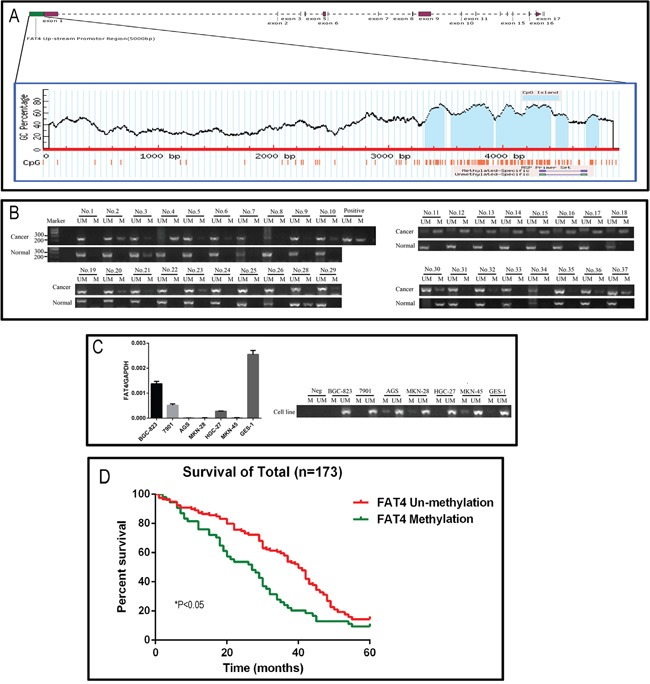
Figure 2. Analysis of FAT4 promoter methylation status and its association with GC.

(A) Schematic representation of the 4.5 kb CpG island region in the human FAT4 gene promoter. (B) The representative picture of the Methylation specific PCR analysis of FAT4 promoter region in GC tissues. The samples Nos. 2, 4 and 11-18 show high FAT4 methylation and Nos. 6, 9, 10 and 32 show low methylation. (C) FAT4 expression levels and methylation specific PCR analysis of FAT4 promoter region in GC cell lines. (D) Kaplan–Meier analysis comparing survival curves of 173 GC patients with and without FAT4 methylation. Patients without FAT4 methylation (red) show increased survival than patients with FAT4 methylation (*P<0.05).
