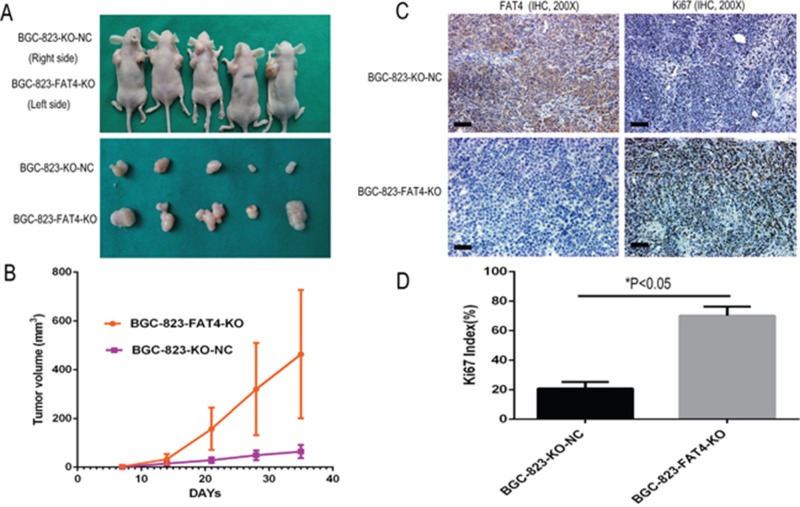
Figure 5. Effect of FAT4 knockout on GC tumorigenesis in the nude mice xenograft model.
(A) Nude mice xenografted (n=5) with BGC-823-FAT4-KO cells (left side) show increased tumor growth (size) than tumors in mice xenografted with control BGC-803-NC cells (right side). (B) BGC-823-FAT4-KO cell derived xenograft tumors show increased tumor volume than control BGC-823-KO-NC cells (*P<0.05). The data points represent mean tumor volume ± SD measured on the indicated days. (C) Representative images show IHC staining of BGC-823-KO-NC and BGC-823-FAT4-KO derived xenograft tumors with antibodies against FAT4 and Ki-67. Scale bar, 100 μm. (D) Histogram plots show percent Ki-67 positive cells in BGC-823-KO-NC and BGC-823-FAT4-KO derived xenograft tumors. As shown, the Ki-67 index is higher in the BGC-823-FAT4-KO derived tumors than BGC-823-KO-NC derived tumors. Data represent mean ± SD from 3 independent experiments. * denotes P < 0.05 compared to control.

