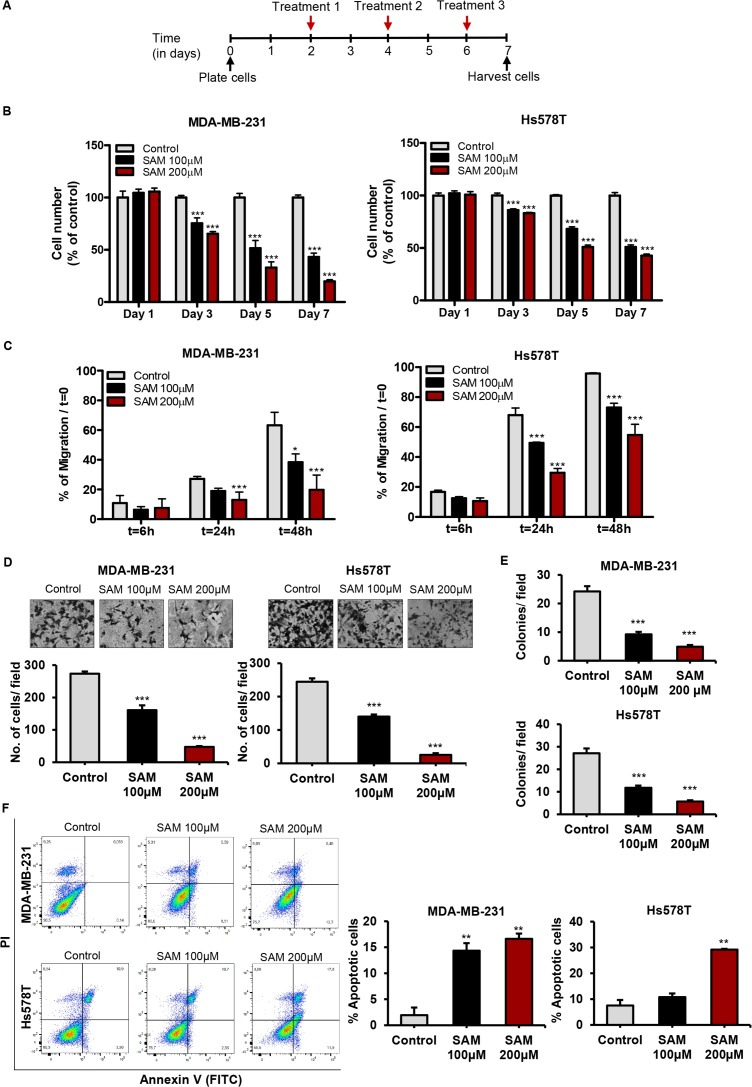
Figure 1. Effect of S-adenosylmethionine (SAM) on breast cancer cell proliferation, migration, invasion, anchorage-independent growth, and apoptosis in vitro.
(A) Schematic diagram of the treatment strategy for all the in vitro experiments. Human breast cancer cells MDA-MB-231 and Hs578T were treated with SAM (100 and 200 μM) by directly adding it to regular growth medium every other day from day 2 until they were harvested. (B) Human breast cancer cells MDA-MB-231 and Hs578T were plated in 6-well plates and treated with vehicle alone as control or SAM (100 and 200 μM). Cell growth rate in each group was determined on day 1, 3, 5, and 7 by Coulter counter as described in Methods. Results are shown as bar graphs of data obtained from three different experiments. (C) Wound healing assay for determining the migration capacity of the cells was carried out by making a cross-like scratch on the plate when they reached 90% confluency. Control and SAM (100 and 200 μM) treated cells were grown in culture media containing 2% FBS and migrating cells were photographed and recorded at different time points, and percentage of wound healing with respect to initial scratch (T0) was calculated using the equation described in ‘Supplementary Materials’. The results are represented as bar graphs obtained from three experiments. (D) Boyden chamber Matrigel invasion assay was used to measure the invasiveness of control and SAM-treated (100 and 200 μM) MDA-MB-231 and Hs578T cells. The cells were placed in the upper chamber, and conditioned media used as ‘chemoattractant’ was added into the lower chamber. Following an incubation period of 18 hours, the invasion process was stopped and the invaded cells from control and 100 and 200 μM SAM-treated groups were fixed, stained and randomly selected fields were counted under the microscope and averaged. Representative image of one randomly selected field for each treatment for both cell lines along with the number of cells invaded per field are shown. (E) After the usual treatment regimen, 5 × 10³ cell from control and SAM-treated (100 μM and 200 μM) groups were plated onto soft agar for anchorage-independent growth assay. The culture media was replenished every other day for two weeks, and the number of colonies was counted. (F) Apoptosis was determined by flow cytometry after staining the control and SAM-treated cells with Annexin V/propidium iodide. Representative contour plots of annexinV-FITC staining of apoptotic cells vs. PI staining for both control and SAM-treated (100 μM) cells are shown. The bar graphs on the right panels show the total percentages of apoptotic cells for different treatments. Results are presented as the mean ± SEM from control and SAM-treated experimental cells. Significant differences were determined using ANOVA followed by post hoc Bonferroni test and are represented by asterisks (*P < 0.05; **P < 0.01, and ***P < 0.001).

