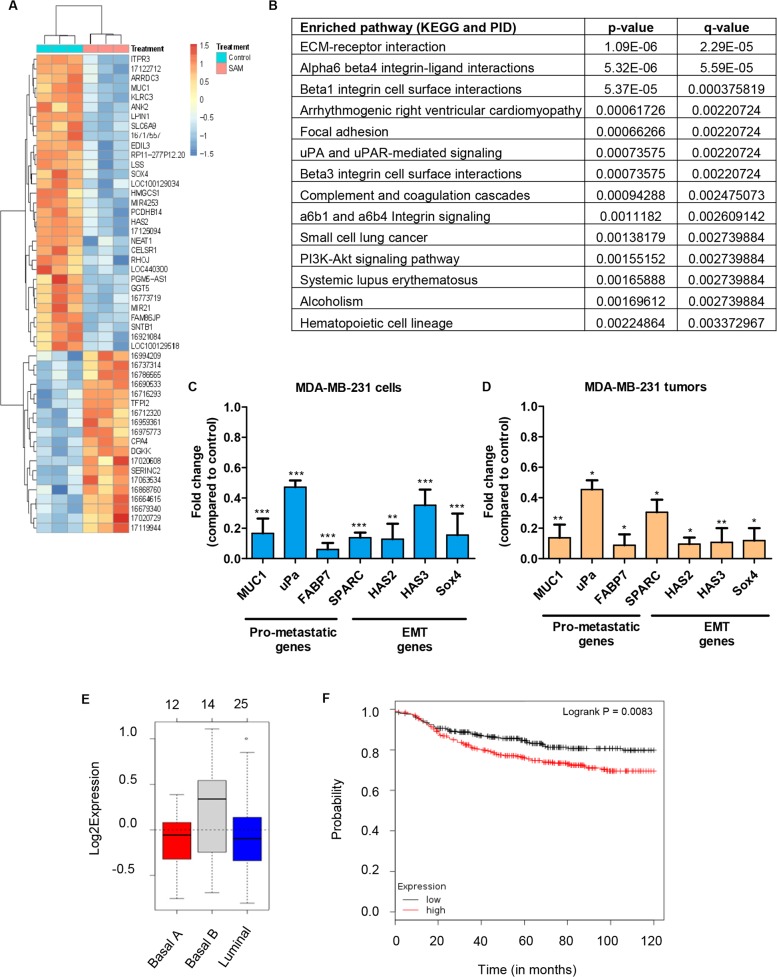
Figure 3. Gene expression analysis of MDA-MB-231 cells and tumors treated with SAM.
(A) MDA-MB-231 cells from control and SAM-treated (200 μM) group were subjected to Affymetrix array and the heat map of the most differentially expressed genes are shown (n=3 in each group). (B) Pathway analysis (from KEGG and PID database) of the genes that are differentially expressed upon SAM-treatment. (C) Selected genes differentially regulated by SAM were validated by quantitative real-time PCR (qPCR) in MDA-MB-231 cells. Results are shown as mean ± SEM of at least three independent experiments. (**P < 0.01, and ***P < 0.001). (D) RNA obtained from the tumor of control and 80 mg/kg/day SAM-treated animals were subjected to qPCR for the same set of genes that showed downregulation by SAM in vitro. Results are shown as mean ± SEM of at least three independent animals per group. (*P < 0.05 and ** P < 0.01). (E) Gene Set Analysis (GSA) representing the expression of these genes in human breast cancer cell lines. (F) Kaplan-Meier plot of distant metastasis free survival from a dataset of 664 breast cancer patients categorized according to the expression of the seven down-regulated genes in Figure 3D.

