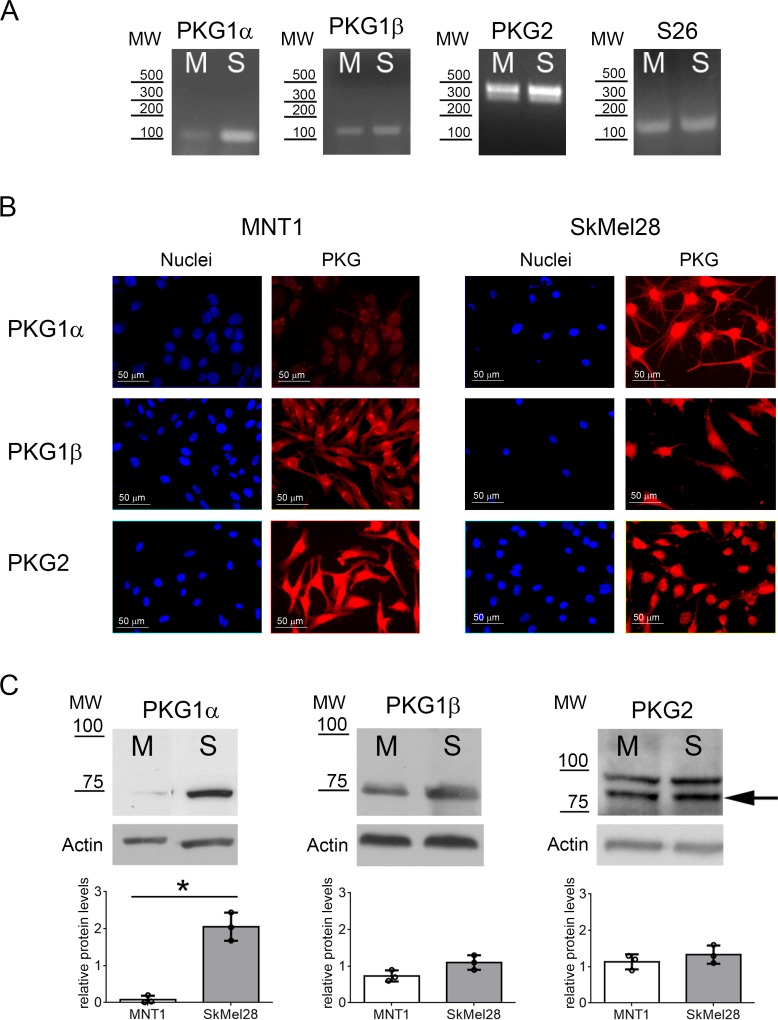
Figure 1. PKG expression in melanoma cell lines.
(A) Expression of PKG1α, PKG1β and PKG2 in MNT1 (M) and SkMel28 (S) was assessed by RT-PCR. S26 was analyzed as reference gene. Primers for PKG2 could detect the two major isoforms that are expressed in both melanoma cell lines. (B) Immunofluorescence analysis using specific antibodies for the three PKG isozymes. (C) Immunoblotting using specific antibodies for the three PKG isozymes in MNT1 (M) and SkMel28 (S). Quantifications of protein levels detected by immunoblotting are shown below of each blot. The arrow indicates the band at the expected molecular weight for PKG2 (86 kDa). MW= Molecular weight: in RT-PCR as base pairs (bp) (A) and in immunoblotting as kDa (C).

