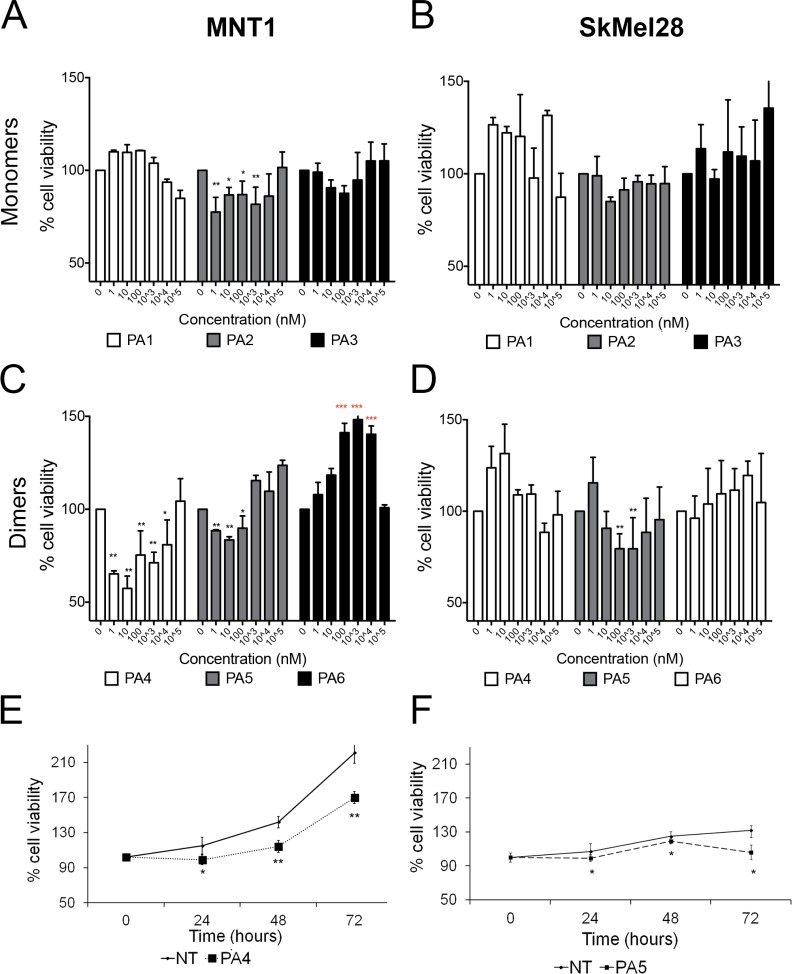
Figure 3. Cell viability assay after treatment with cGMP analogues.
In all experiments values of not treated cells (NT) were set as 100% cell viability. (A–B) Dose responses in MNT1 (A) and in SkMel28 (B) treated with monomeric cGMP analogues for 24 h. (C–D) Dose-responses in MNT1 (C) and in SkMel28 (D) treated with dimeric cGMP analogues for 24 h. (E) Time-course assay in MNT1 cells treated with PA4 at 1 μM (*p = 0.04). (F) Time-course assay on SkMel28 treated with PA5 at 1 μM (p = 0.03*). Error bars: SD. Statistical comparison: in A-B-C-D NT vs treated at each concentration with Student's unpaired two-tailed t-test; in E-F NT vs treated using Student's paired two tailed t-test. Significance levels: p < 0.05 = *p < 0.01 = **p < 0.001 = ***. Red asterisks indicate significant increase of cell viability.

