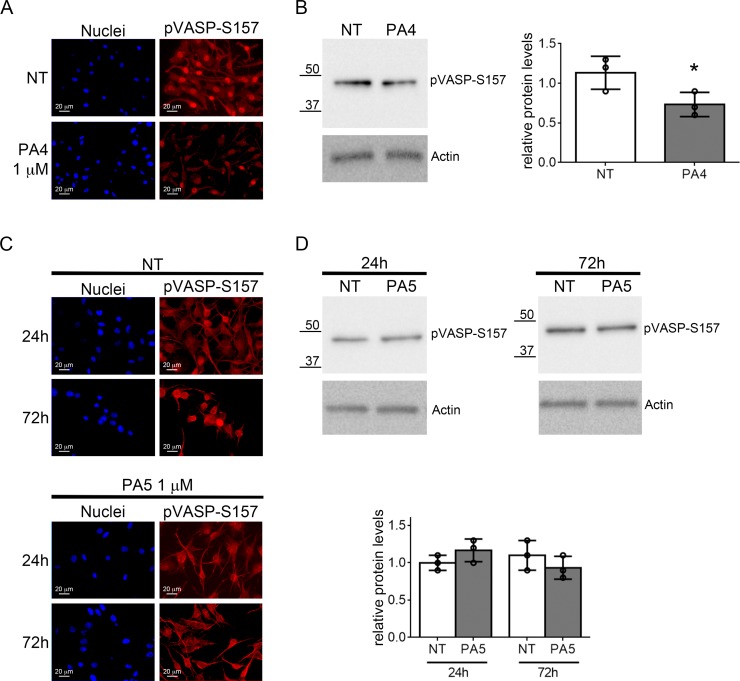
Figure 8. Analysis of VASP phosphorylation at S157.
(A–B) VASP phosphorylation at S157 was evaluated in MNT1 cells not treated (NT) or treated with PA4 at 1 μM for 24 h. (A) Immunolocalization of S157 pVASP shows decreased pVASP after treatment. (B) Immunoblotting of pVASP phosphorylated at S157 in MNT1 cells. The immunoblot was normalized by analysis of actin. The histogram at the right-hand side shows quantitative analysis of three replicates. (C–D) VASP phosphorylation at S157 was evaluated in SkMel28 cells not treated (NT) or treated with PA5 at 1 μM for 24 h or 72 h. (C) Immunolocalization of S157 pVASP shows no change after treatment. (D) Immunoblotting of pVASP at S157 in SkMel28 cells after treatment with PA5 at 1 μM for 24 h or 72 h. The immunoblot was normalized by analysis of actin. The histogram shows quantitative analysis of three replicates. Error bars: SD. Statistical comparison: NT vs treated with Student's unpaired two-tailed t-test; Significance levels: p < 0.05 = *p < 0.01 = **p < 0.001 = ***.

