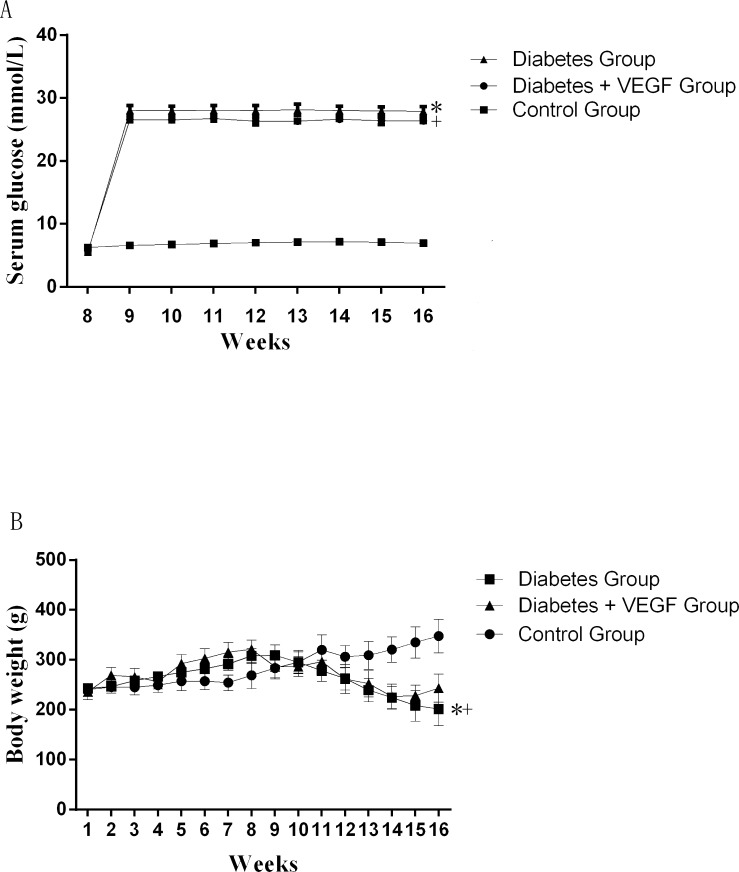
Figure 1. The change of serum glucose and body weights.
Serum glucose (A) and body weights (B) in diabetes rats compared to control group and diabetes +VEGF group. Diabetes group and diabetes + VEGF group were intraperitoneally injected with STZ at week8. From week 9, diabetes + VEGF group was daily treatment with VEGF. +*P < 0.05 compared with control group, +p > 0.05, compared with diabetes group (n=8).

