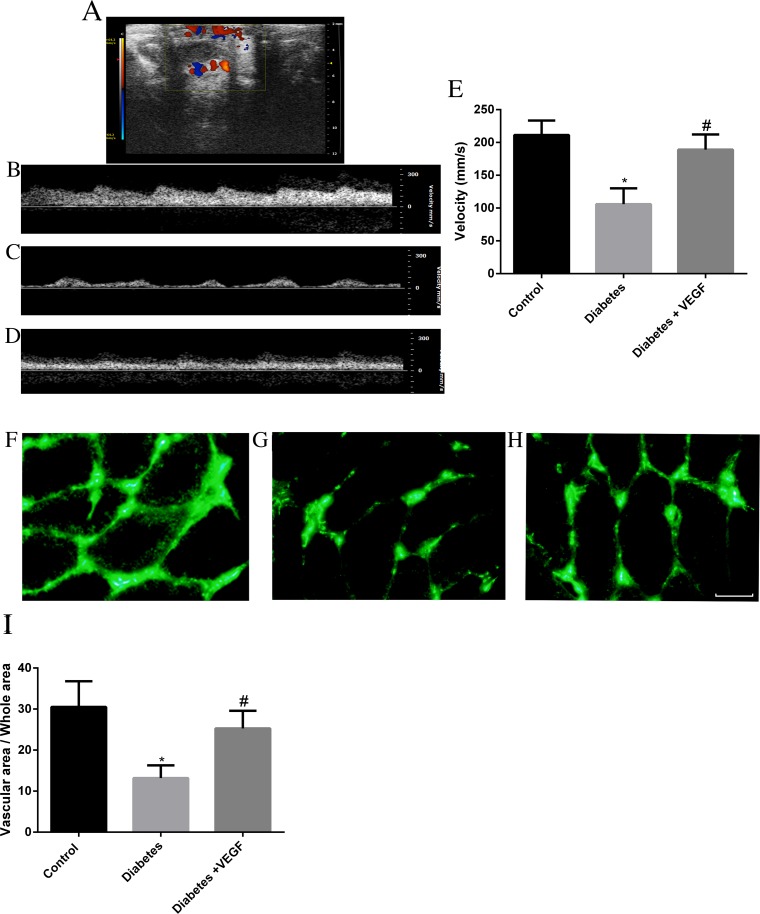
Figure 3. Color Doppler sonography analysis and FITC-dextran label was performed in all groups.
(A) Color Doppler ultrasound image from a diabetes + VEGF rat testis indicated localization of testicular blood vessel. Testicular blood flow rate in control group (B), diabetes group (C), and diabetes + VEGF groups (D) were showed by spectral analysis. Quantitative evaluation of velocity was showed in (E). FITC-dextran was used to label vascular area. The rats from control group (F), diabetes group (G), and diabetes + VEGF groups (H) were perfused with fluorescein isothiocyanate (FITC)-dextran (green) from tail vein. Slides were prepared for each group and analyzed by fluorescence microscopy (200×). (I) Quantification of vascular areas in the testes of rats. Three fields per section and five sections from each testis. Data presented as means ± SEM, n = 8 rats for each group. #p < 0.05, compared to control group and diabetes group; *p <0.05, compared to control group and diabetes + VEGF group.

