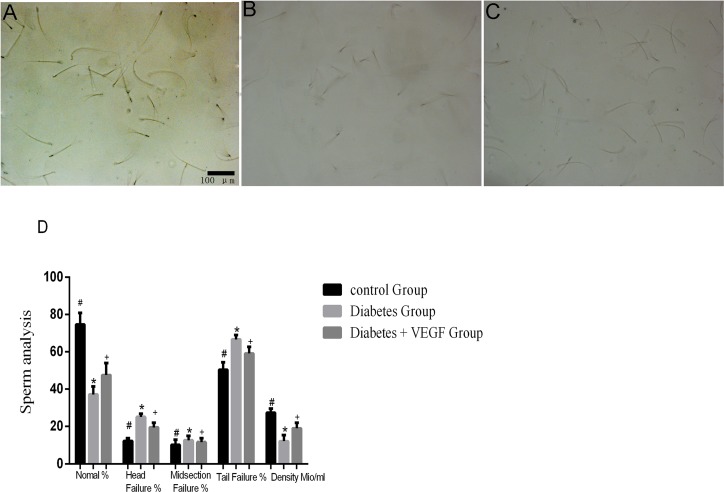
Figure 5. Sperms conditions in all groups.
Sperms from control group (A), diabetes group (B) and diabetes + VEGF group (C) in 16-week age. Sperms were squeezed out and observed by microscope (200×). Sperm analysis were present in (D) *Significantly different from control group (p < 0.05); +significantly different from diabetes group and control group (+p versus control group < 0.05; +p versus diabetes group < 0.05).

