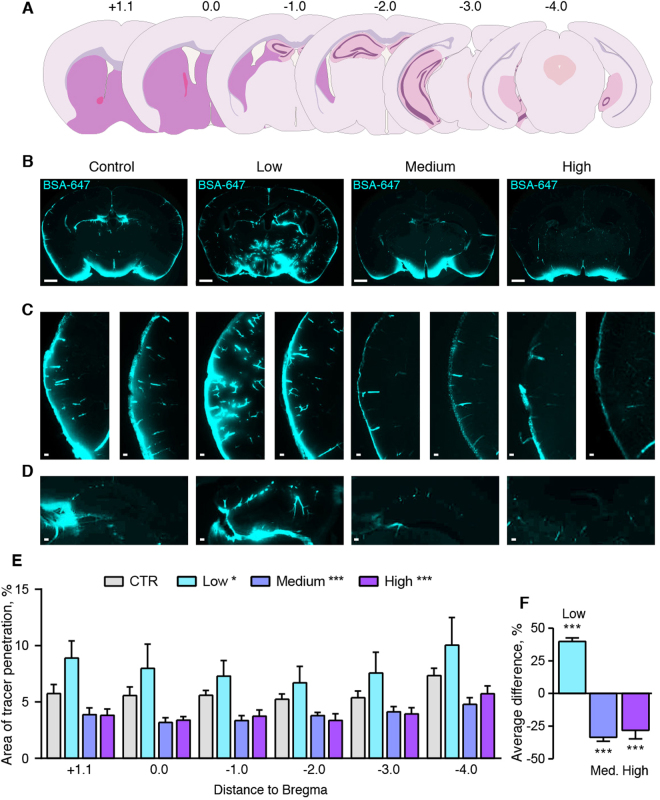
Figure 1.
Low or high alcohol doses have opposite effects on CSF tracer penetration. (A) Representation of the coronal brain slices used in analysis to assess glymphatic function, with anterior-posterior distance indicated in mm in relation to bregma. (B) Coronal sections of mouse brain at 30 minutes after cisterna magna injections of Alexa-647-conjugated bovine serum albumin (BSA-647) in awake mice. Scale bars: 1 mm. (C) Tracer influx in the cortex in two different representative mice. Scale bars: 100 µm. (D) Influx in the hippocampus at bregma −1 mm. Scale bars: 100 µm. (E) Area covered by tracer influx in coronal brain slices collected 30 minutes after cisterna magna tracer injection in mice given saline or alcohol 15 minutes before they were injected with CSF tracer. X-axis indicates the distance to bregma. CTR, saline control; low, medium, high, 0.5, 1.5 and 4 g/kg ethanol, respectively. 2-way ANOVA compared to control. (F) Average difference compared to control for all brain slices analyzed. One-way ANOVA compared to control. *p < 0.05, **p < 0.01, ***p < 0.001. Bar graphs represent mean and standard error of the mean (SEM) of 7–9 mice per group.

