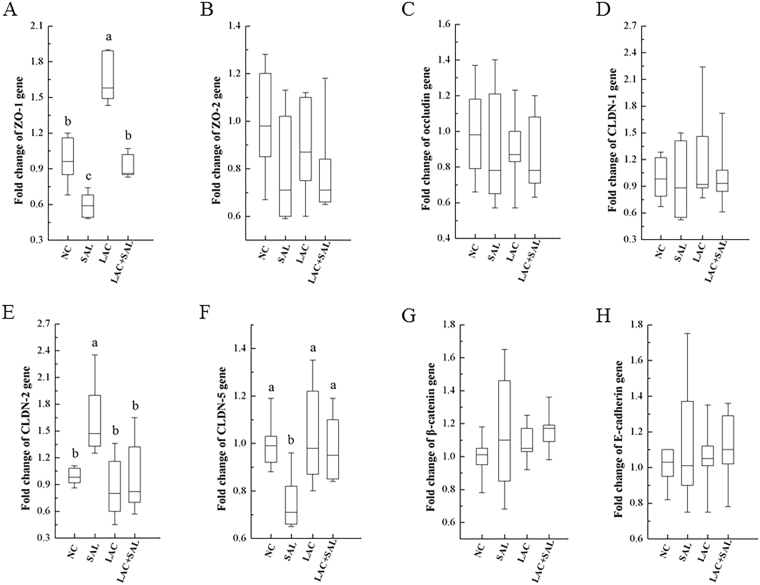
Figure 3.
Relative expression levels of TJ and AJ associated genes in the ceca of newly hatched chicks. NC, the negative control, no L. plantarum LTC-113 treatment, no Salmonella infection; SAL, the Salmonella-infected group; LAC, the L. plantarum LTC-113-treated group; LAC + SAL, the L. plantarum LTC-113-treated and Salmonella-infected group. abcDifferent letters mean significant differences among groups (P < 0.05, n = 6). Box plots show the fold change of genes. Boxes extend from the third quartile (Q3) to first quartile (Q1), with the line at the median.

