Figure 1.
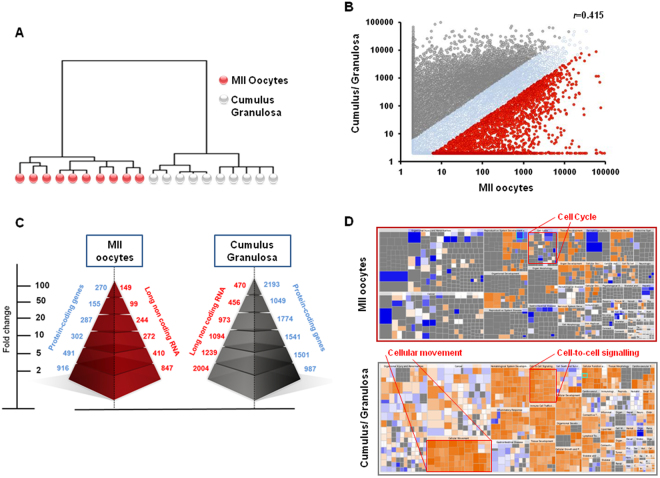
Differences in the global gene expression profiles of human mature MII oocytes and cumulus granulosa samples. (A) Unsupervised hierarchical clustering the 10,000 genes with the highest variation coefficient. The dendrogram shows that their expression profiles cluster cumulus granulosa cell and MII oocyte samples (n = 10/each group) in two distinct groups. The 10 oocytes used for RNA-seq were obtained from nine 25- to 35-year-old patients. (B) Scatter plot showing the distribution of gene expression fold changes. The Pearson correlation coefficient (r) value is shown in the plot. Gene expression data were normalized as Reads Per Kilobase Million (RPKM). (C) Number of upregulated protein-coding genes and lncRNAs in MII oocyte and cumulus granulosa samples. SAM analysis identified 2,422 protein-coding genes that are upregulated in MII oocytes and 9,045 protein-coding genes that are upregulated in cumulus granulosa samples. Of these, 270 and 2,193 coding genes showed a fold change ≥100 in MII oocytes and cumulus granulosa cells, respectively. Moreover, 2,021 and 6,236 lncRNAs were upregulated in MII oocytes and in cumulus granulosa samples, respectively. Of these, 149 and 470 lncRNAs showed a fold change ≥100 in MII oocytes and cumulus granulosa cells, respectively. (D) Analysis of significantly represented Gene Ontology (GO) terms. Results were generated by IPA of differentially expressed genes. The heat map colors correspond to the relative expression of genes represented in the subgroups of the major annotations terms. For instance, most ‘cell cycle’ genes were upregulated in MII oocytes, whereas most ‘cell-to-cell signaling, cellular movement’ genes were upregulated in cumulus granulosa cells. Orange, upregulated genes; blue, downregulated gene expression.

