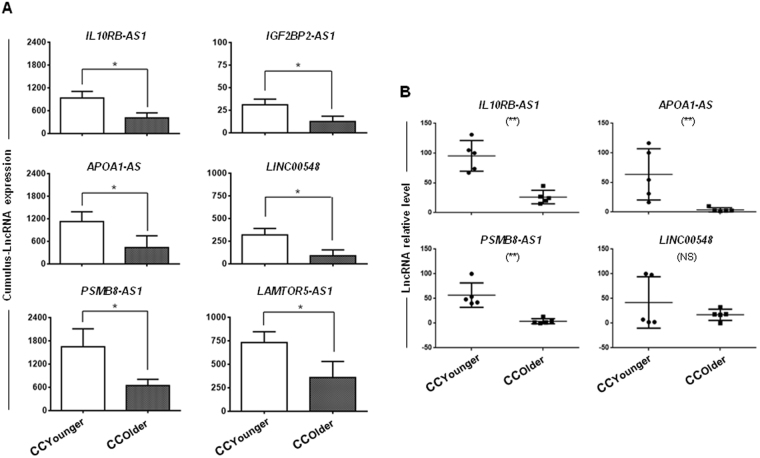
Figure 6.
Expression profiles of CC-lncRNAs according to the donors’ age. (A) Histograms show the expression level of six lncRNAs (IL10RB-AS1, APOA1-AS, IGF2BP2-AS1, LINC00548, PSMB8-AS1 and LAMTOR5-AS1) in CC samples from young (<35 years) and older patients (>40 years of age) (n = 9 sample/group). The number of reads is shown on the y-axis as arbitrary units determined by the RNA-seq analysis. *Significant difference with FDR ≤0.05 according to SAM. (B) Validation by qRT-PCR analysis of the expression profile of some lncRNAs that are differentially expressed in older and younger patients (n = 5 samples/group). The signal intensity (arbitrary units) for each lncRNA is shown on the Y-axis; **Significant difference with p-value = 0.0079. NS: not significant.

