Fig. 3.
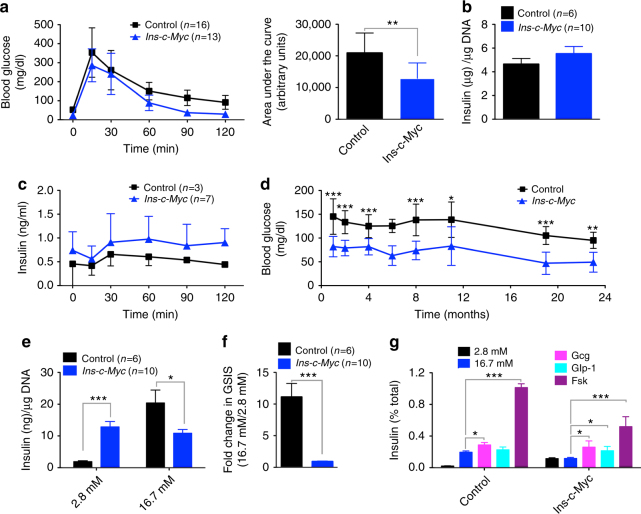
Imprecise glucose regulation in mice with stabilized c-Myc in β cells. a Glucose tolerance tests on three-month-old mice Ins-c-Myc animals (n = 13) as compared to littermate controls (n = 16). The corresponding area under the curve is noted. Error bars indicate ± SD. **p < 0.005, Student’s t test. b Total insulin content in islets from transgenic (red bar, n = 10) and control (black bar, n = 6) animals. Error bars indicate ± SEM. c In vivo IPGTT on the transgenic (n = 7) and controls (n = 3) mice. Error bars indicate ± SD. d Measurement of glycemia under fed conditions in Ins-c-Myc and control animals. Numbers of control and transgenic animals analyzed at 1, 2, 4, 6, 8, 11, 19, and 23 months were: 22, 21; 27, 27; 22, 20; 6, 2; 5, 7; 5, 6; 17, 18; and 6, 5 respectively. Error bars indicate ± SD. *p ≤ 0.05, **p < 0.005, ***p < 0.0005, Student’s t test. e In vitro glucose stimulated insulin secretion in islets from transgenic (red bars, n = 10) and control (black bars, n = 6) animals at basal (2.8 mM), and high (16.7 mM) glucose levels. Error bars indicate ± SEM. *p ≤ 0.05, ***p < 0.0005, Student’s t test. f Stimulation index of insulin secretion in transgenic islets (red bar, n = 10) as compared to controls (black bar, n = 6). Error bars indicate ± SEM. ***p < 0.0005, Student’s t test. g In vitro glucose stimulated insulin secretion in islets from 6-month-old transgenic (n = 3) and control (n = 3) in the presence of basal glucose (2.8 mM), high glucose (16.7 mM), glucagon (10 nM), Glp-1 (100 nM) or forskolin (100 μM). Error bars indicate ± SEM. *p ≤ 0.05, ***p < 0.0005, Student’s t test

