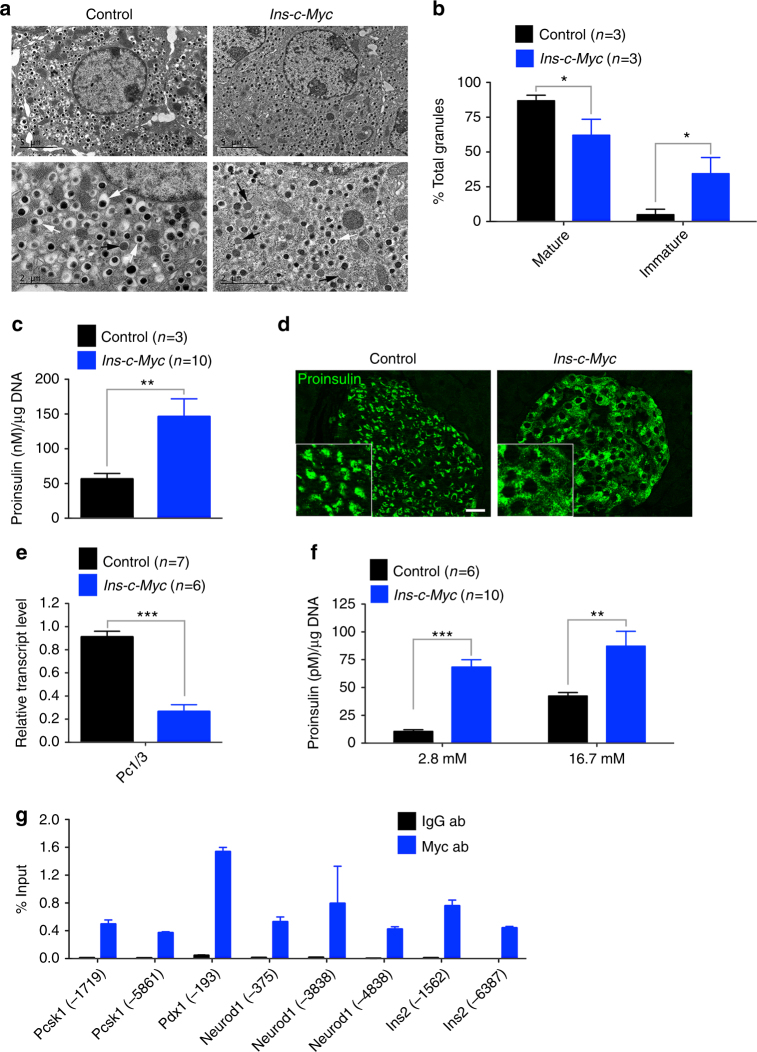
Fig. 4.
Accumulation of features of immaturity in c-Myc-expressing β cells. a Electron microscopy shows accumulation of classical mature insulin granules with a dark core surrounded by a clear halo (white arrows) in control islets. Immature granules have a less dense core and poorly defined halo (black arrows). Top panel, scale bar: 5 μm, lower panel, scale bar: 2 μm. b Quantification of mature and immature granules in control (black bars, n = 3) and transgenic (red bars, n = 3) samples. Error bars indicate ± SD. *p < 0.05, Student’s t test. c Total proinsulin content in islets isolated from control (black bar, n = 6) and transgenic (red bar, n = 10) animals. Error bars indicate ± SEM. **p < 0.005, Student’s t test. d Immunostaining for proinsulin reveals a diffuse distribution of proinsulin-containing vesicles in the transgenic islets. Scale bar: 20 μm. e Quantitative PCR to determine the level of Pc1/3 in transgenic islets (red bar, n = 6) as compared to control islets (black bar, n = 7). Error bars indicate ± SD. ***p < 0.0005, Student’s t test. f Proinsulin secretion from transgenic (red bars, n = 10) versus control (black bars, n = 6) islets under basal (2.8 mM) and stimulatory (16.7 mM) glucose conditions. Error bars indicate ± SEM. **p < 0.005, ***p < 0.0005, Student’s t test. g Chromatin immunoprecipitation analysis to assess the recruitment of Myc to upstream canonical binding sites in the genes shown on Ins-c-Myc islets (n = 2). IgG was used as the negative control. Data are shown as percent of input. Error bars indicate ± SD

