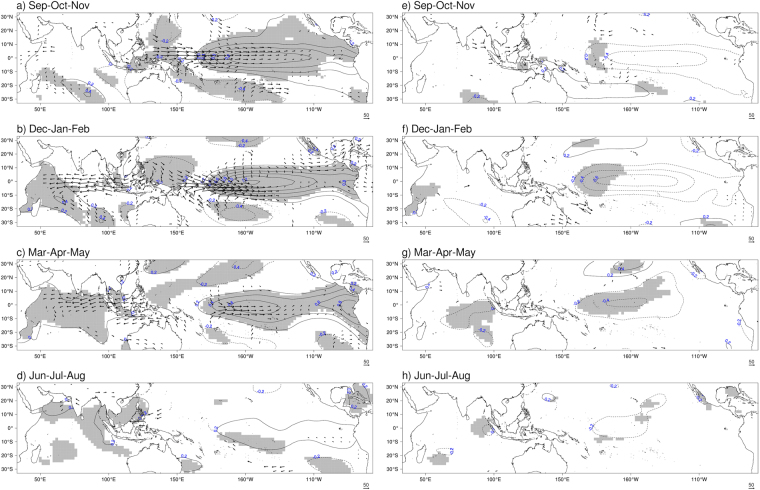
Figure 4.
Composites of deviations from the mean for sea-surface temperatures (contour) and humidity flux (vector) anomalies for Peninsular Malaysia case. Composites are calculated for years of lower FFB (left column) and years of higher FFB (right column). Only humidity flux anomalies significant at the 95% level (according to Hotelling’s T2 test) are plotted. Grey shading denotes SST anomalies significant at the 95% level (according to two-sided Student’s t-test). Composites are calculated for SON (a,e), DJF (b,f), MAM (c,g) and JJA (d,h). The figure was generated by R software version 3.4.1 (https://www.R-project.org/) with package “rasterVis” version 0.41.

