
Figure 4.
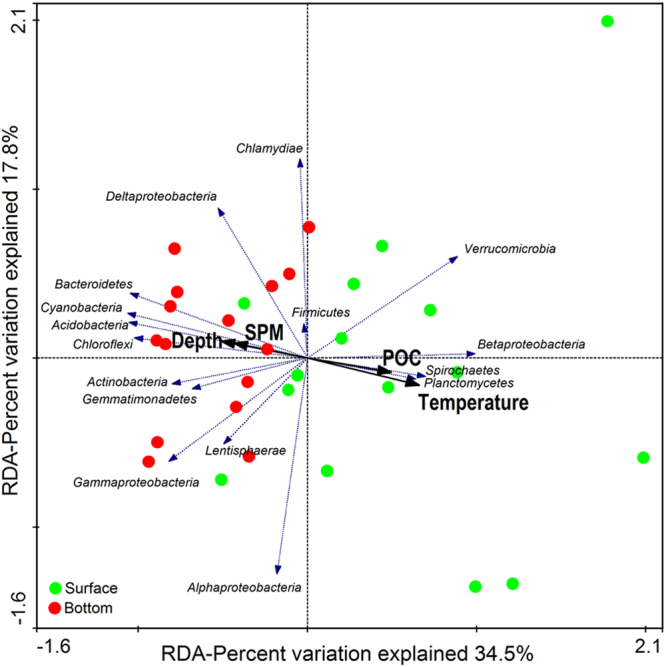
Redundancy analysis of the relationship between environmental parameters (black arrows) and bacterial community distributions of surface (green circles) and bottom (red circles) water column of Hangzhou Bay. Taxonomic information is shown at the phylum level (and subdivision level for Proteobacteria). Only P value of environmental parameter <0.05 (999 times Monte-Carlo permutation test) and average abundance of taxa >1% are shown.