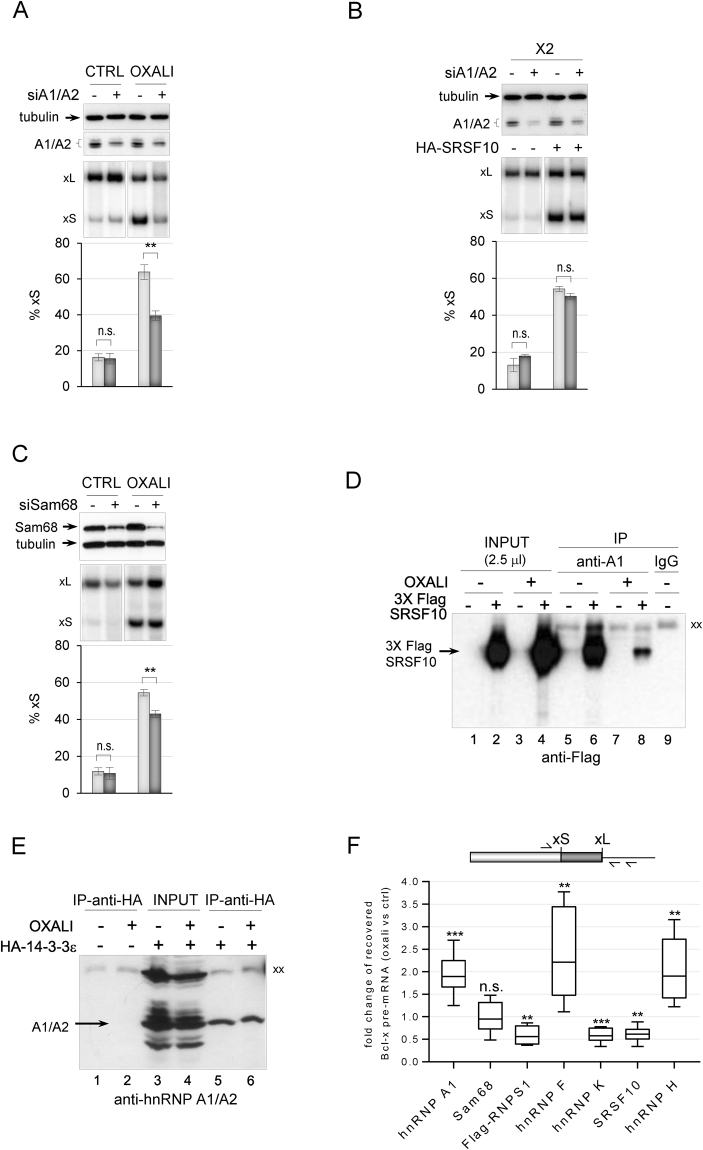
Figure 3.
The depletion of hnRNP A1/A2 and Sam68 impairs the DDR modulation of Bcl-x splicing. (A) RT-PCR assays on endogenous Bcl-x transcripts using total RNA extracted from 293 cells transfected with siA1/A2 (96 hours). Cells were treated with or without 25 μM of oxaliplatin for the last 22 hours. The immunoblot analysis is shown, with tubulin as a loading control. (B) RT-PCR assays on X2 transcripts using total RNA extracted from 293 cells transfected with the X2 minigene, siA1/A2 and HA-SRSF10. The immunoblot analysis of the depletion is shown. (C) RT-PCR assays on endogenous Bcl-x transcripts using total RNA extracted from 293 cells transfected with siSam68 (72 hours) and treated with or without 25 μM of oxaliplatin for the 22 hours of that period. The immunoblot analysis to confirm the depletion of Sam68 is shown. In panels (A–C) the percentage of the Bcl-xS variant is plotted based on experiments performed in triplicates. (D) Anti-hnRNP A1 immunoprecipitation assays using 293 cells treated or not with oxaliplatin and transfected or not with FLAG-SRSF10. The material recovered was fractionated and transferred on nitrocellulose decorated with anti-FLAG antibodies. (E) Immunoprecipitation assays using 293 cells treated or not with oxaliplatin and transfected or not with HA-14-3-3ε. The material recovered was fractionated and transferred on nitrocellulose decorated with anti-hnRNP A1/A2 antibodies. “xx” and “x” respectively indicate the large and small immunoglobulin subunits that react with the secondary antibody. (F) Immunoprecipitations were carried out on cells treated or not with oxaliplatin. The recovered RNA was quantitated for Bcl-x pre-mRNA using primers shown on top. Raw data and control immunoprecipitations with IgG are provided in Supplementary Table S1. The box plots show the fold change of Bcl-x pre-mRNA recovered from the oxaliplatin-treated samples versus the non-treated control observed in three independent assays. Boxes indicate the median, the upper and lower quartiles, while whiskers display minimum and maximum values. The P values were determined by performing one-sample t test (compared to the hypothetical value of 1 (no change)) using GraphPad Prism. In panels A–C, error bars indicate SD. Asterisks represent significant P values (two-tailed Student’s t test) comparing the means between samples and their respective controls. *P < 0.05, **P < 0.01 and ***P < 0.001; n.s. = not significant. Gels and blots cropped from different parts of the same gels/blots are indicated by white space between sections in panels A–C.

