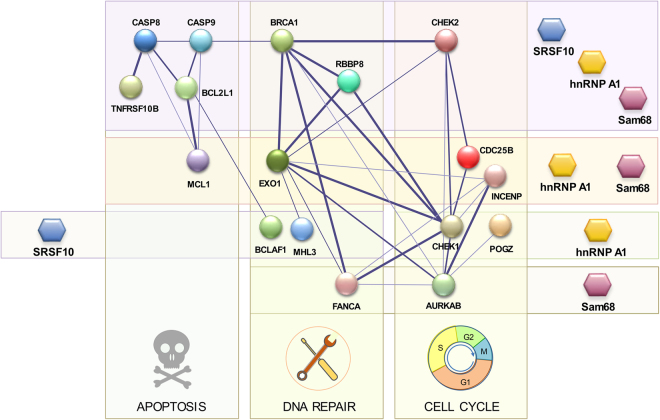
Figure 6.
Splicing regulatory network. Graphical representation of splicing regulation of a functional interaction network of proteins involved in DDR. Circles (nodes) correspond to genes with ASEs that respond to oxaliplatin and that are regulated by hnRNP A1/A2, Sam68 and SRSF10. Lines (edges) indicate interactions and their thickness indicates confidence in data that support the interaction based on the STRING database49. Only components with connections are shown (18 of 34 of the oxaliplatin-sensitive ASEs regulated by the three RBPs). Target transcripts are organized vertically in groups that function in apoptosis, DNA repair and cell-cycle control; and horizontally, by individual or combinations of RBPs controlling their splicing.

