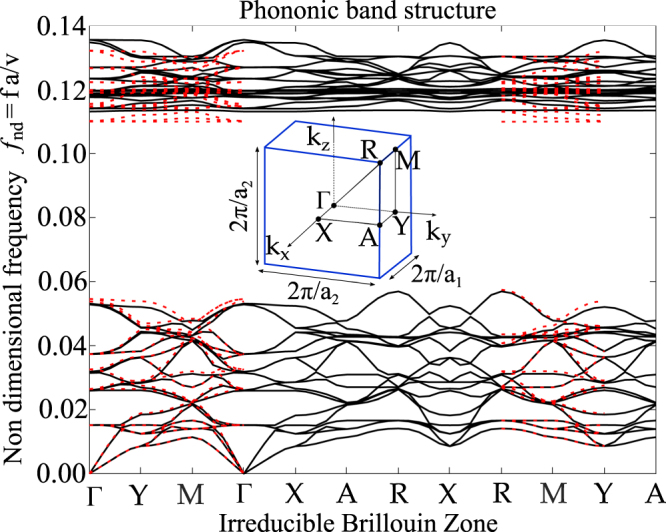
Figure 3.

Dynamic analysis of the deformed unit cell. In red dotted line, the dispersion plot of the undeformed configuration shown in Fig. 2a. In solid black line, the dispersion plot of the deformed configuration of the unit cell (due to opposite applied displacements to ellipsoides in direction x equal to q = 0.005a) computed in COMSOL Multiphysics. The tetragonal IBZ for the deformed configuration is reported, where a1 = a + 2q, a2 = a + 1.2q. The same quantity a is used for frequency normalization.
