Fig. 1.
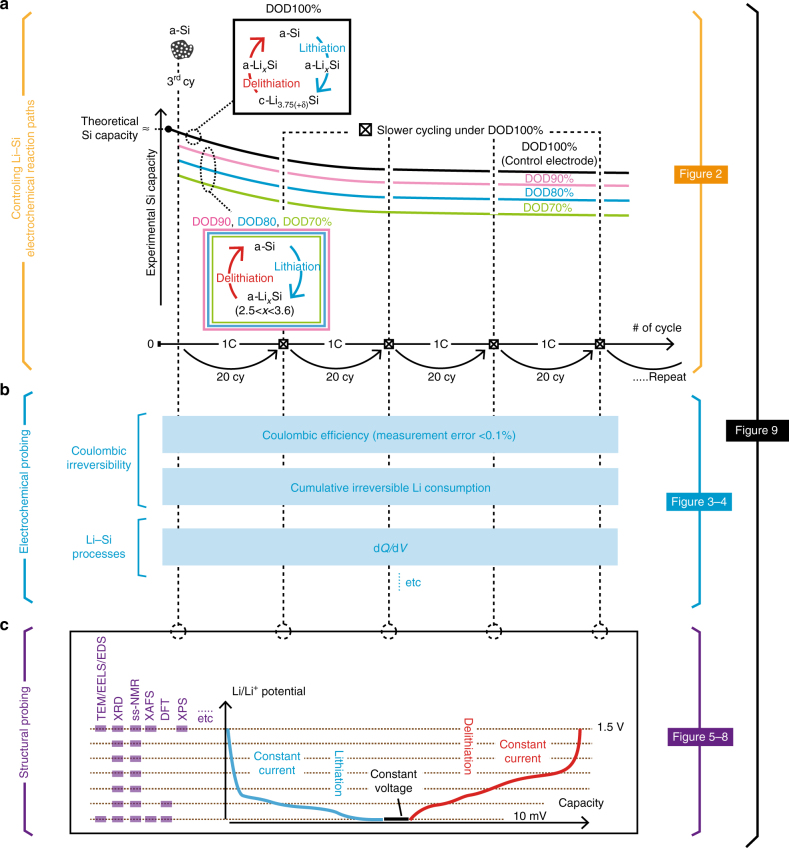
Schematics of experimental scheme. The overall experimental scheme is illustrated in (a–c). a Li–Si electrochemical reaction paths are controlled by capacity-cutoff depth of discharge (DOD)%. After polycrystalline Si nanoparticles (pc-SiNP) are fully amorphized in the first two cycles, DOD% is controlled from the third cycle on to 70, 80, 90, or 100% (indicated by green, blue, pink, and black solid lines, respectively). As shown in colored rectangular boxes, under the DOD100% protocol, the system displays an amorphous–crystalline Li–Si phase transformation, while DOD70–90% displays amorphous–amorphous volume changes. b Electrochemical outputs to be probed under different DOD controls, such as Coulombic efficiency (CE), and cumulative irreversible Li consumption, and dQ/dV profiles. The capacity of electrodes is carefully designed such that the first reversible capacity under DOD100% agrees with the Si theoretical capacity to ~99% accuracy (see Methods under “Baseline active materials”). c Various analyses used for structural probing, which is conducted every 20 cycles at slower current rates under DOD100%, in order to capture the structural characteristics for the full potential range for different DOD controls (see Methods under “Electrode fabrication and cycling conditions”). Figures corresponding to (a–c) in the following section are labeled on the right side

