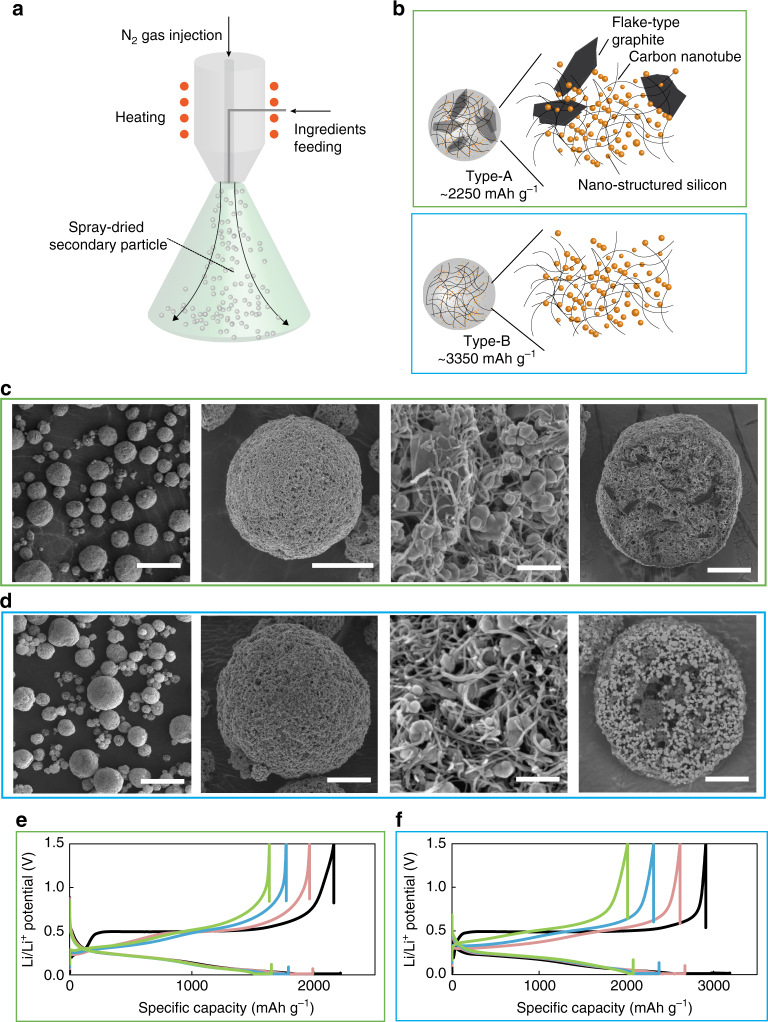
Fig. 2.
Preparation of active materials with different Si concentrations. Schematic of (a) the spray-drying process for secondary particle fabrication and (b) spray-dried type-A and -B secondary particles (with the first reversible capacity being 2250 and 3350 mAh g−1, respectively) as active materials. Particles with two different Si concentrations are used in this study to confirm consistency of the electrochemical outputs with different Si concentrations. For more detailed material properties for these particles see Supplementary Table 4. The schematics for type-A and -B are surrounded by green and blue empty rectangles in (b), respectively. SEM/BSE images of (c) type-A and (d) type-B secondary particles. The three images on the left in (c, d): planar views by SEM with different magnifications, on the right in (c, d): FIB cross-sectional views by BSE. The scale bars in the images (from left to right) in (c, d) are 20 µm, 5 µm, 200 nm, and 5 µm, respectively. (e, f) Li/Li+ potential as a function of specific capacity on the 10th cycle for different capacity-cutoff depth of discharge (DOD) percentages for (e) type-A and (f) type-B electrodes. The black, pink, blue, and green profiles correspond to cycling under DOD100%, 90%, 80%, and 70%, respectively

