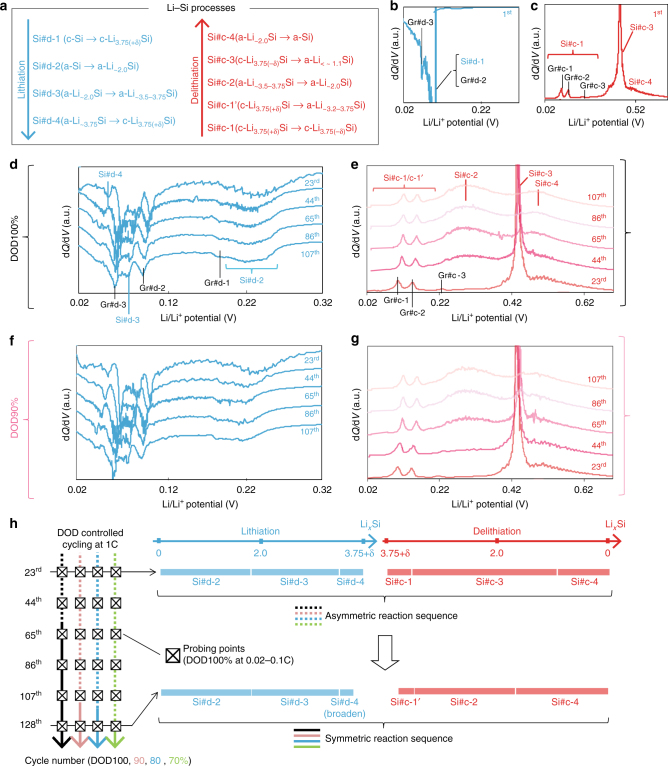
Fig. 3.
Evolution of Li–Si electrochemical processes over cycling under different DOD controls. a Notation of the stoichiometric Li–Si electrochemical processes on (de)lithiation. Si#d-X and Si#c-X are Li–Si processes, while #d-X and #c-X denote the Xth discharge (lithiation) and charge (delithiation) processes in the half-cells, respectively. For corresponding Gr#d-X and Gr#c-X processes, see Supplementary Fig. 3. The notations are also summarized in Methods (under “Reference electrochemistry”) and Supplementary Table 5. dQ/dV profiles for type-A electrodes in the first (b) lithiation (discharge) and (c) delithiation (charge). dQ/dV profiles at the probing points (every 20 cycles at 0.1 C under DOD100%) on (d, f) lithiation and (e, g) delithiation for (d, e) DOD100% and (f, g) DOD90%, respectively. The dQ/dV profiles are stacked with a constant pitch to show the different processes more clearly. h Schematics of change in the electrochemical Li–Si process flow at the probing points during (de)lithiation over cycling under different DOD controls. The stoichiometry of each process is indicated by the length of each bar on lithiation (blue bars) and delithiation (red bars) as a function of Li concentration in LixSi. The reaction flow in the earlier cycling stage is asymmetric (dotted lines), while that in the later stage is symmetric (solid lines). The transition from the asymmetric to symmetric regimes is clearly accelerated by undergoing DOD100% protocol. The corresponding data for type-B electrode are shown in Supplementary Fig. 4 with the same tendency as in here

