Fig. 4.
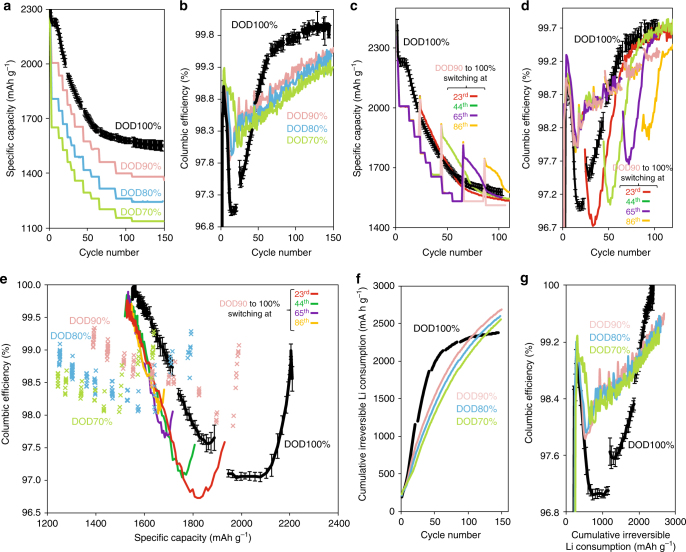
Baseline electrochemical properties under different lithiation depth controls. Electrochemical properties for type-A electrodes under different depth of discharge (DOD) controls. a Specific capacity and (b) Coulombic efficiency (CE) for different DOD controls over 150 cycles. c Specific capacity and (d) CE for DOD90% switched to DOD100% at different cycle numbers; the switching points for red, green, purple, and yellow solid lines are the 23rd, 44th, 65th, and 86th cycles, respectively. e CE as a function of the specific capacity for different DOD controls. Colored solid lines (red, green, purple, and yellow) show the profiles switched from DOD90% to DOD100% in (c, d). CE is clearly the highest under DOD100% after a certain loss of reversible capacity. f Cycle number plotted over accumulated irreversible Li consumption. The cumulative consumption is the lowest among the given DODs after certain cycles. g CE plotted over accumulated irreversible Li consumption. CE under DOD100% protocol is the highest among the given DOD controls after a certain amount of sacrificial Li consumption. Note that the CE error bars for DOD70–90% are all below ±0.1% and therefore omitted in (b, d, e, g). The corresponding results for type-B electrode are shown in Supplementary Fig. 13

