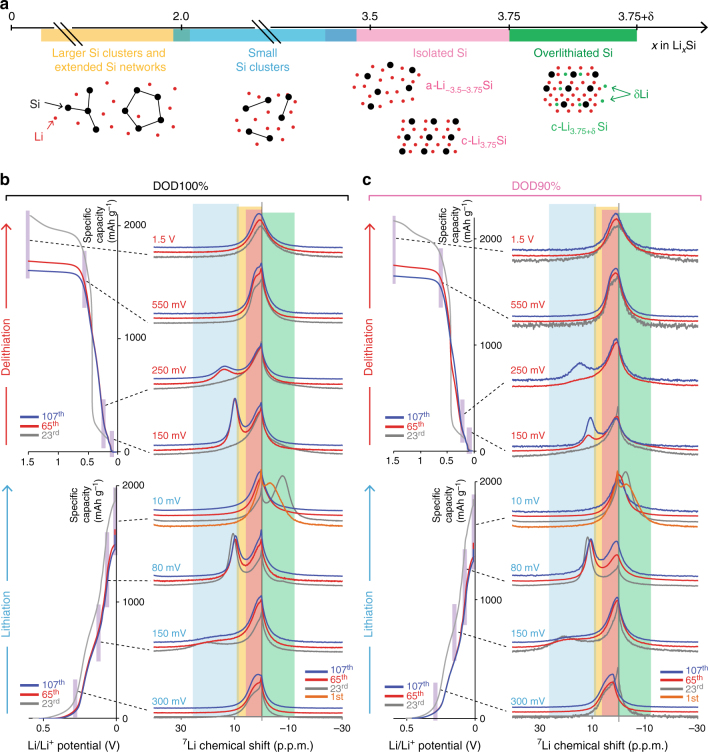
Fig. 7.
Ex situ MAS 7Li solid-state NMR spectra at various (de)lithiation potentials. a Schematics of various Li–Si local environments as a function of Li concentration in Li–Si alloys. The 7Li resonances are highlighted by yellow (10–0 p.p.m., larger Si clusters and extended Si networks), blue (25–10 p.p.m., small Si clusters), pink (6–0 p.p.m., isolated Si4− anions including c-Li3.75Si), and green (0 to −10 p.p.m., overlithiated crystalline phase, c-Li3.75+δSi). The notations for the Li–Si environments and their correlation with the Li–Si electrochemical processes are also summarized in Supplementary Table 5. The recorded spectra at various Li/Li+ potentials over 107 cycles at the probing points under (b) depth of discharge (DOD)100% and (c) DOD90%. The NMR spectra at each potential are linked to the corresponding points in the capacity–voltage profiles. Orange, gray, red, and blue solid lines correspond to the spectra at the 1st, 23rd, 65th, and 107th cycles, respectively. The spectra for different cycle numbers and different potentials are stacked with constant pitch to show the different processes more clearly

