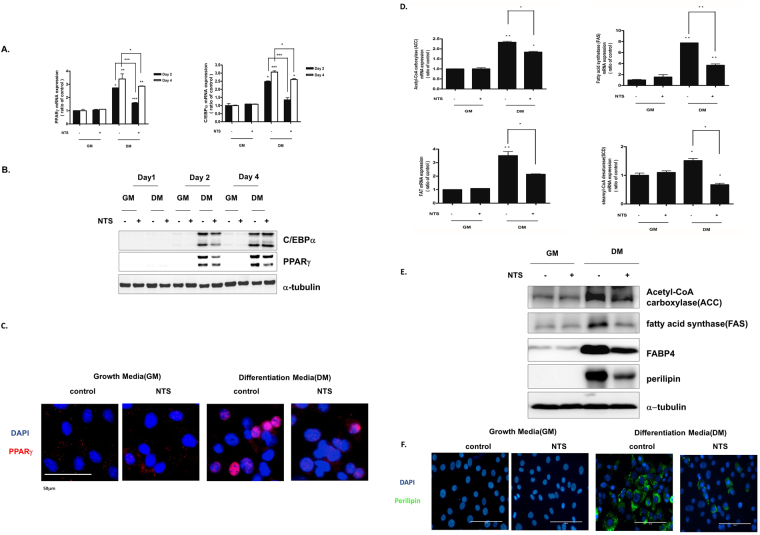
Figure 4.
Inhibitory effect of NTS on key adipogenic transcription factors in 3T3-L1 pre-adipocytes. (A) Quantitative real-time PCR was used to quantify the effect of NTS on adipogenic transcription factors PPARγ and C/EBPα. Results are presented as mean ± SD of three independent experiments. Significant difference: ***p < 0.001; **p < 0.01; *p < 0.05 compared with the control group. (B) Western blot analysis showing the effect of NTS on PPARγ and C/EBP α levels. (C) Immunocytochemical assay for PPARγ (adipogenic transcription factor, Red) and DAPI (nucleus stain, Blue). Scale bar = 100 μm. (D) On day 4, adipocyte specific markers (fatty acid synthase, ACC-acetyl-CoA carboxylase, FAT, and SCD-1-stearoyl-CoA desaturase) were analyzed by real-time PCR using mRNA isolated from NTS-treated 3T3-L1 pre-adipocytes. (E) Proteins were extracted and expression levels of FAS, ACC, FABP4, and perilipin were determined by Western blot. Each Western-blotting band represents three experiments performed in triplicate. (F) Immunocytochemical assay for perilipin (lipid droplet marker, green) and DAPI (nucleus stain, blue). Scale bar = 100 μm.

