Abstract
Novel water resistant photocatalytic composites of microfibrillated cellulose (MFC)—polyamide-amine-epichlorohydrin (PAE)—TiO2 nanoparticles (NPs) were prepared by a simple two-step mixing process. The composites produced are flexible, uniform, reproducible and reusable; they can readily be removed from the pollutant once used. Small amount of TiO2 NPs are required for the loaded composites to exhibit a remarkable photocatalytic activity which is quantified here as achieving at least 95% of methyl orange degradation under 150 min of UV light irradiation for the composite with best combination. The cellulose network combined with PAE strongly retains NPs and hinders their release in the environment. PAE dosage (10 and 50 mg/g MFC) controls the NP retention in the cellulose fibrous matrix. As TiO2 content increases, the photocatalytic activity of the composites levels off to a constant; this is reached at 2wt% TiO2 NPs for 10 mg/g PAE and 20wt% for 50 mg/g PAE. SEM and SAXS analysis confirms the uniform distribution of NPs and their formation of aggregates in the cellulose fibre network. These economical and water resistant photocatalytic paper composites made by a simple, robust and easily scalable process are ideal for applications such as waste water treatment where efficiency, reusability and recyclability are important.
Introduction
Inorganic nanoparticles-polymer composites have recently gained much attention for engineering functional materials and interfaces. Metals and metal oxides nanoparticles (NPs) such as TiO21, Au2 and Fe2O33 are distinct materials with size dependent properties in photocatalysis and photoelectronics applications4. Among those, TiO2 NPs are low cost material for industrial applications in photocatalysis, photochemical hydrogen production5, water purification and solar energy conversion6,7. There are many recent publications related to TiO2 photocatalysis8–16.
In 1972, Fujishima and Honda discovered photocatalysis with TiO2 NPs17. Anatase TiO2 gives high oxidizing power when irradiated by UV light, which has generated tremendous interest thanks to its low cost, high chemical stability and low toxicity18–20. Optical excitation with energy exceeding TiO2 band gap energy results in the formation of conduction band electrons and valence band holes. Both are powerful reductants and oxidants21. Hydroxyl radicals produced in TiO2 can be used to convert many organic compounds to CO2 and H2O. Therefore, TiO2 has been used to decompose various environmental pollutants22,23. The size and the length scale of these NPs play a major role in its properties and applications24.
Nano scale TiO2 (1–100 nm) possesses high surface area and shows enhanced photocatalytic activity24. However, TiO2 tendency to form agglomerates can significantly decrease its activity25–27. Using bare TiO2 NPs in water treatment has issues in their collection and poses uncontrolled NPs release as an environmental danger28–31. Incorporating TiO2 NPs directly into a matrix combines the advantages of NPs stability and retention; this enables water treatment without risk of NPs leaching or contamination32.
Previously, researchers have engineered composites with TiO2 NPs embedded in different networks such as silicon, carbon fibre, cellulose fibre and polypropylene/clay33–36. However, these composites have issues either in retention of NPs, are expensive to produce, difficult to recycle, non-biocompatible, lack of reusability or are not showing effective or controlled photocatalytic activity. There is a lack of fundamental understanding of the retention, dispersion and aggregation of NPs for the controlled photocatalysis activity of composites.
Many strategies have been explored for retaining inorganic NPs in sustainable material networks37–39. In this category, microfibrillated cellulose (MFC) is a low cost, biodegradable and recyclable natural fibrous matrix having high specific strength and surface area promising good NPs integration31,40,41. MFC is more stable in aqueous environments than conventional wood fibres42,43. Previously, many methods to produce and characterise MFC-NPs composites with high NP loadings (80 wt%) and controlled nanostructures were reported38,44,45.
We raise the hypothesis that the content and the aggregation state of TiO2 in MFC composites control their photocatalytic activity when exposed to UV light. Our proposed methodology is to disperse TiO2 NPs in a MFC network with controlled retention, distribution and agglomeration, while keeping the wet strength of the produced composites. These parameters are believed to be important variables for optimizing the photocatalytic activity of composites. Therefore, a material which serves as both wet strength and NP’s retention aid is required. Polyamide-amine epychlorohydrin (PAE) is a widely used wet-strength agent in the tissue and packaging industries. Its wet strength develops primarily by ester bond formation between the azetidinium groups of PAE with the carboxyl groups of the bleached cellulose fibres and is achieved during the drying process46.
In this study, MFC is investigated as TiO2 NPs carrier to produce water resistant fibrous composites of varying NPs loading. Here, PAE is used both as wet strength agent to consolidate the MFC structure and as a retention aid for the TiO2 NPs. Photocatalytic activity of composites with different NPs and PAE dosages is monitored by measuring the degradation kinetics of Methyl Orange (MO) solutions by UV irradiation. By changing the PAE concentration, we aim to vary the TiO2 aggregation state. Scanning electron microscopy (SEM) and Small angle X-ray Scattering (SAXS) measurements are used to quantify TiO2 NP distribution in the composites and are analysed in terms of PAE content. Our objective is to produce bio-compatible and reusable TiO2 NPs/MFC composites of controlled photocatalysis. Further, we aim at exploring TiO2 catalytic activity in terms of NPs distribution and aggregation state controlled with PAE dosage.
Results
The photocatalytic activity of water resistant, thin and flexible cellulose/PAE/titanium dioxide (TiO2) nanoparticles (NPs) composites was investigated by following the UV induced degradation kinetics of Methyl Orange (MO) dye aqueous solutions. Composites varying in TiO2 NPs and PAE contents were prepared. The UV-vis spectroscopy for MO aqueous solutions denotes two distinct absorption peaks appearing at 275 nm and 500 nm (Fig. 1). The band at 500 nm was selected to measure the effect of photocatalysis on the degradation of MO as this peak decreases rapidly as increases UV light exposure time of the photocatalytic material (Supplementary Fig. S1). In 3 hours, the colour of the MO solution changes from an intense red/orange to colourless, which indicates degradation of MO (Fig. 1 inset).
Figure 1.
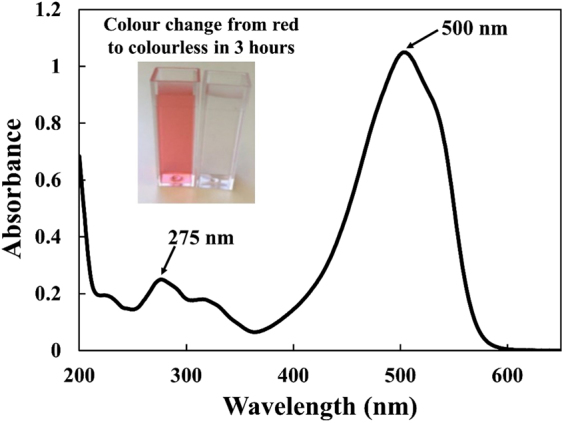
UV-visible spectrum of a methyl orange aqueous solution indicating two absorption maxima. The inset illustrates the methyl orange solution colour change by photocatalysis before and after 3 hours UV exposure over TiO2-MFC composite.
Photocatalytic activity performance
The photocatalytic degradation kinetics of MO is shown as a function of TiO2 loading for 10 and 50 mg PAE/g MFC in Fig. 2a,b, respectively. The intensity of the MO peak decreases with exposure time for all composites. Although the rate at which MO decomposes changes for different composites, it takes roughly 3 hours for MO colour to change from the original red/orange colour to transparent and colourless (Fig. 1 inset).
Figure 2.
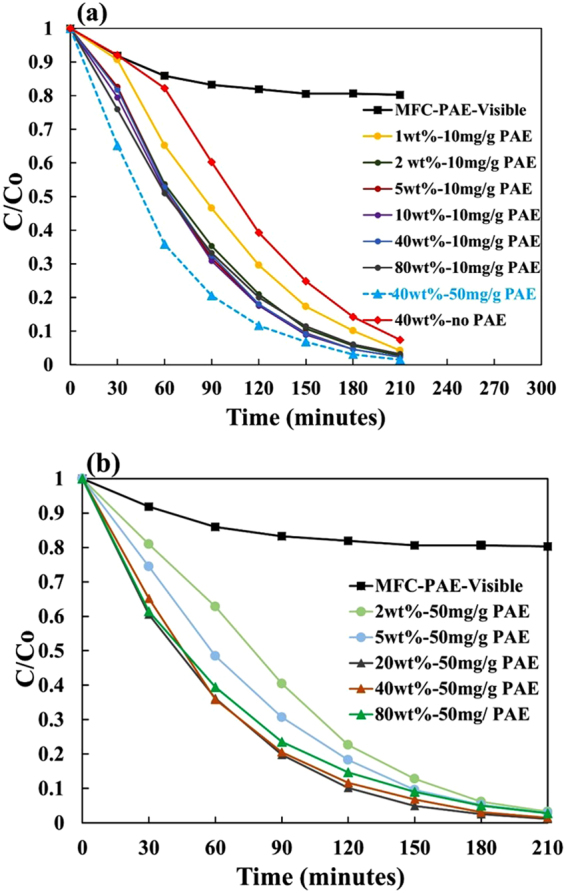
Photocatalytic activity of TiO2-MFC composites with different TiO2 loadings retained with (a) 10 mg PAE/g MFC and (b) 50 mg PAE/g MFC.
There is virtually no photocatalytic activity shown by composites without TiO2 (MFC-PAE only) as indicated in Fig. 2 (filled squares). Due to the initial adsorption of the MO dye onto MFC, its concentration initially decreased by ~20% in about 2 hours as MFC-PAE paper is kept under visible light. The adsorption equilibrium is gradually reached after 4 hours. Therefore, all test samples were kept in MO solutions and in the dark for 2 hours prior to UV light irradiation.
The performance of the TiO2-MFC composites made with lower PAE dosage (10 mg/g) is shown in Fig. 2a. As TiO2 loading increased to 1 and 2 wt%, the photocatalytic activity systematically increased. At 2 wt%, a noticeable increase in photocatalytic activity was observed compared to 1 wt%. Composites with addition levels of 5 to 80 wt% TiO2 behaved similarly to 2 wt% and showed the highest photocatalytic activity for this group. Photocatalytic activity decreased in a weak exponential fashion to 20% of the original dye concentration after ~120 minutes for the 2–80 wt% TiO2 composites group and ~150 minutes for the 1 wt% TiO2 composite.
The degradation curve for 40 wt% TiO2-MFC composite with no PAE is also shown in Fig. 2a (filled diamonds). There is still photocatalytic activity; this suggests that some TiO2 NPs are retained- even with no PAE present.
The performance of TiO2-MFC composites with the high PAE dosage (50 mg/g) is shown in Fig. 2b. The degradation pattern is similar to that of composites with 10 mg/g; however, the photocatalytic activity saturation is reached at 20 wt% TiO2 loading and remains constant thereafter. The overall degradation rate with 20–80 wt% TiO2 was faster than for composites made with 10 mg/g (indicated by plotting the degradation graph for 40 wt% TiO2 sheet with 50 mg/g in Fig. 2a-dotted line). Here, the photocatalytic activity decreased to 20% of the original dye concentration after ~90 minutes for the 20–80 wt% TiO2 composites group and ~120 minutes for the 2–5 wt% TiO2 composite group.
Photocatalysis repeatability
Uniformity of the sheet and photocatalytic activity repeatability was measured by cutting two test strips (2.5 cm × 2.5 cm) from two different locations from the same original composite. Reproducibility of sheet was tested by preparing two different composite sheets with the same TiO2, MFC and PAE content and testing their photocatalytic activity. Figure 3a,b show an excellent repeatability and reproducibility in the MO photocatalytic degradation from composite sheets made with 2 wt% and 5 wt% TiO2 retained with 10 mg PAE /g.
Figure 3.
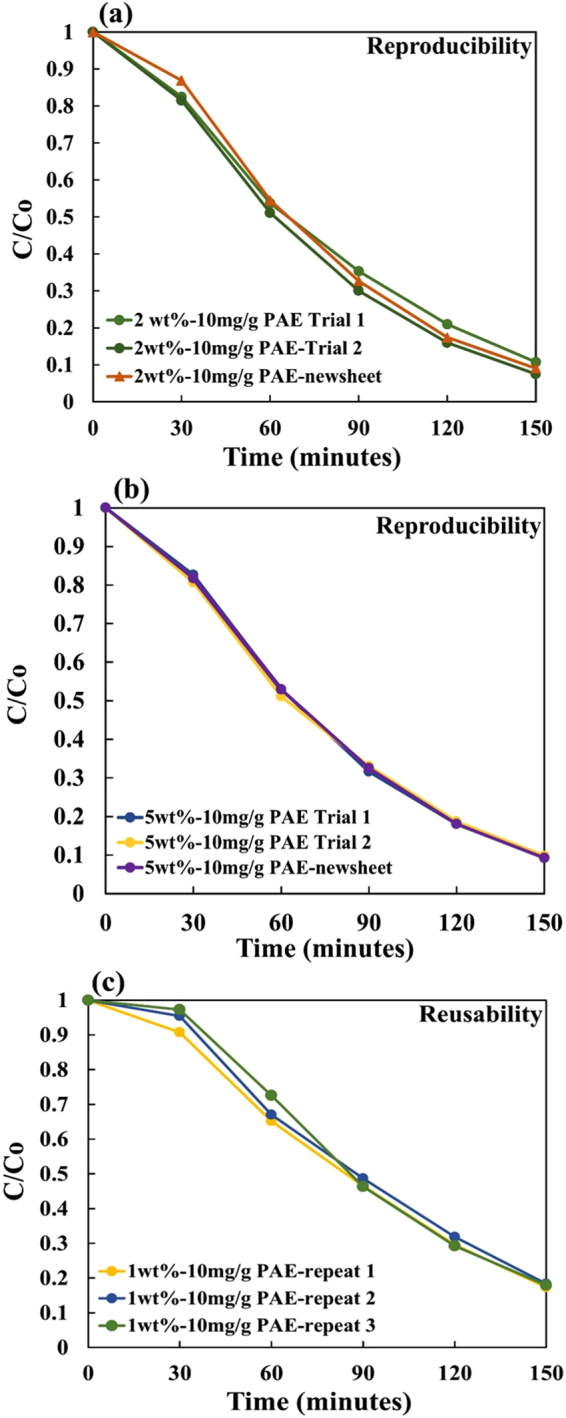
Photocatalytic repeatability and reproducibility for MO solution degradation over UV irradiated MFC-TiO2 composites made with 10 mg PAE/g MFC and: (a) 2 wt% and (b) 5 wt% TiO2; (c) Composite reusability for 3 full testing cycles (1 wt% TiO2 and 10 mg PAE/g).
Sheet reusability was measured by testing the photocatalytic activity of the same sample 3 times. After each run, the test piece was washed with deionized water to remove any MO residue and dried. The photocatalytic activity of the composite sheets with 1 wt% TiO2 and PAE 10 mg/g remains identical even after 3 cycles (Fig. 3c).
PAE effect on MFC flocculation
The adsorption isotherm of PAE onto MFC is presented in Fig. 4. PAE has a high affinity for MFC as shown by the initial linear portion of the curve having a slope of 1 (Fig. 4 inset). The linear part of the curve states that all PAE in solution adsorbs onto MFC until a concentration of 10 mg/g. The PAE adsorption then slows down, to eventually reach a plateau at around 15 mg PAE/g MFC. The kinetics of polyelectrolyte adsorption and the mechanism of inorganic filler coagulation rate as a function of polyelectrolyte is studied in the past47,48.
Figure 4.
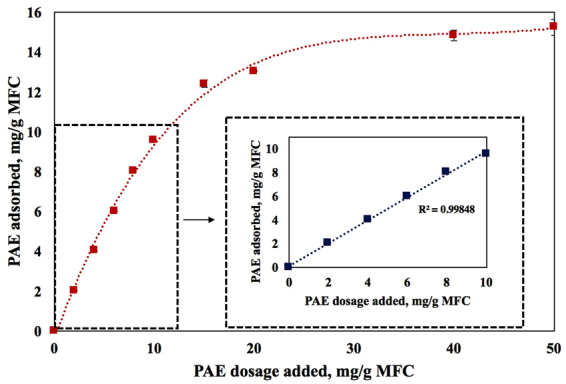
Adsorption isotherm of PAE adsorbed on MFC as a function of PAE concentration in solution. The inset highlights the linear adsorption portion at low PAE concentrations. Error bars indicate the standard deviation.
Figure 5 shows the MFC zeta potential as a function of PAE concentration. MFC has a zeta potential of −26 mV, while that of TiO2 is −11 mV (shown by filled square). MFC charge increases linearly with PAE concentration up to 10 mg/g, corresponding to a charge of +25 mV, to level off thereafter and reach a plateau at +40 mV for a PAE dosage of 50 mg/g. Colloids having an absolute charge higher than 25 mV are considered to be stable. This means that MFC is expected to be stable in solution, while there is a possibility for TiO2 to form some small or weak aggregates in solution, and even to weakly deposit onto MFC. However, MFC and TiO2 NPs fully covered by PAE are expected to be strongly electrostatically stabilized; no TiO2 aggregates nor TiO2 adsorption onto MFC are expected.
Figure 5.
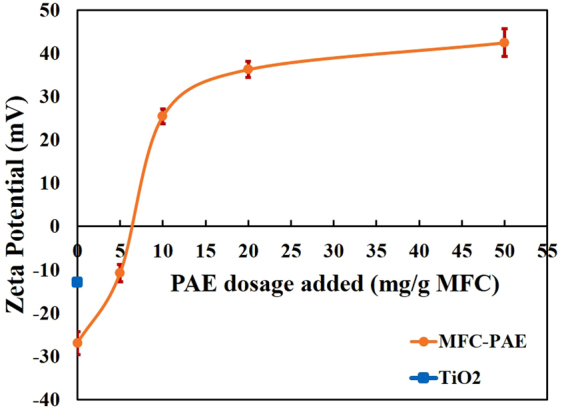
Zeta potential of PAE-MFC suspensions as a function of PAE dosage (mg PAE/g MFC). The supernatant of PAE in a MFC suspension was analyzed after centrifugation according to the reported work of Garnier et al.57.
Retention efficiency of TiO2 in the composites
Retention efficiency is defined as the actual TiO2 NPs present in the composite sheet over the total amount used. Retention was measured from mass balance during composite preparation. Figure 6 shows the actual TiO2 NPs retention in the composite plotted with respect to NP loading. The retention of NPs increases linearly up to 30 wt% NPs for both PAE dosages. A drop in the retention efficiency for both PAE dosage is observed as increases NPs loading. Afterwards the retention of NPs for 10 mg/g PAE drops faster than for 50 mg/g PAE. For 80 wt% NP loading, the composite with 10 mg PAE /g retains 50% of the NPs, while that with 50 mg PAE /g retain 60% NPs.
Figure 6.
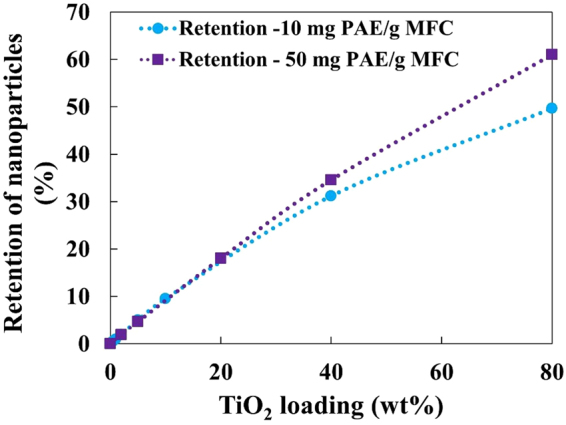
Retention of TiO2 nanoparticles as a function of initial TiO2 loading for different dosages of PAE (10 mg/g and 50 mg/g).
TiO2 and MFC morphology in composites
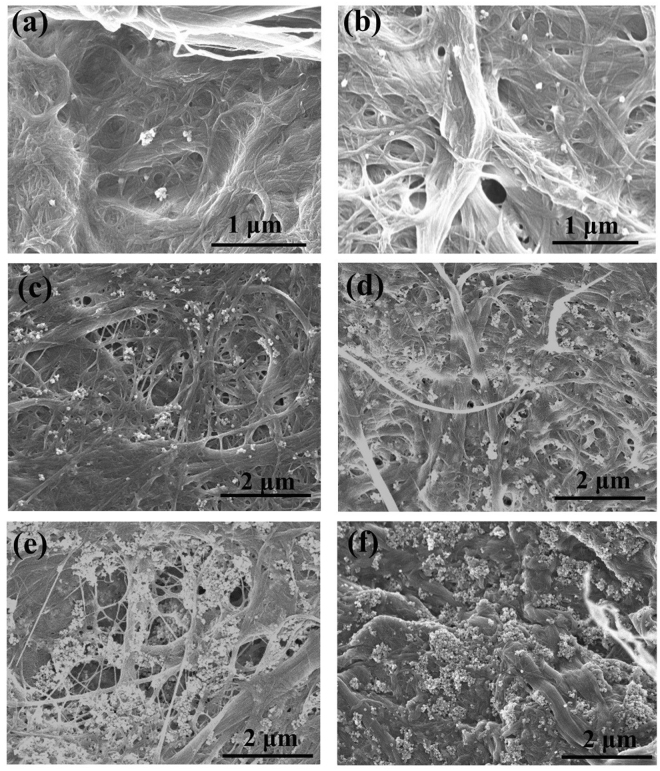
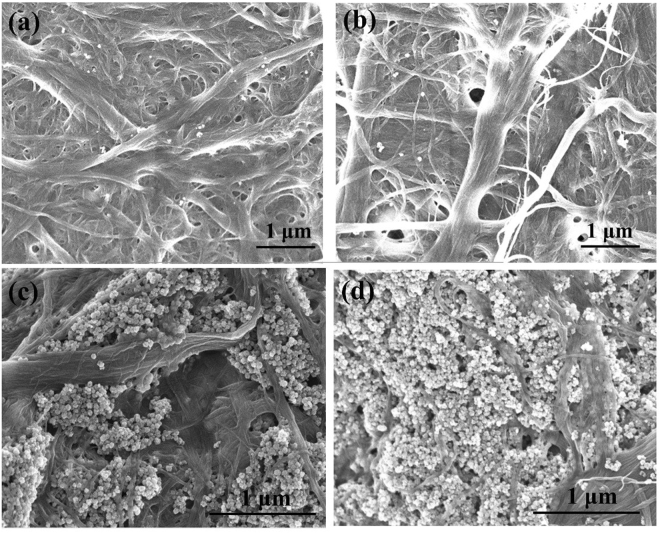
Scanning electron microscopy (SEM) was performed on all MFC/TiO2 composites with PAE dosage of 10 mg/g and 50 mg/g and different TiO2 NP’s content (Figs 7 and 8). For 10 mg PAE/g, individual NPs or very small TiO2 aggregate are present on the composite surface for 1–2 wt% TiO2 loadings (Fig. 7a,b). Relatively large TiO2 aggregates are observed for 5–80 wt% TiO2 loadings (Fig. 7c–f); the NP surface coverage seems to be similar for 40 wt% TiO2 loadings and higher.
Figure 7.
SEM images of TiO2 composites with 10 mg PAE/g MFC: (a) 1 wt%, (b) 2 wt%, (c) 5 wt%, (d) 10 wt%, (e) 40 wt% and (f) 80 wt% TiO2.
Figure 8.
SEM images of TiO2 composites with 50 mg PAE/g MFC: (a) 2 wt%, (b) 5 wt%, (c) 20 wt%, and (d) 80 wt% TiO2.
For composites with 50 mg PAE/g, individual TiO2 NPs are seen up to 5 wt% loading (Fig. 8a,b), beyond which NPs aggregates into big clusters (Fig. 8c,d). Again, the surface coverage of TiO2 present at higher loadings (20–80 wt%) all looks identical but higher than those made with the lower PAE dosage (10 mg/g).
Interestingly, TiO2 NPs aggregates are present on the surface of MFC fibres rather than in the pores formed between fibres (Figs 7 and 8). This is due to the preparation method, where PAE is added first to MFC to create a PAE monolayer on MFC, followed by TiO2 addition onto the MFC-PAE suspensions. The aggregates are irregular in shape and size. The MFC fibre structure does not change even at high TiO2 loading; TiO2 NPs do not accommodate themselves in the pores between fibres.
Small angle X-ray scattering (SAXS)
Small angle X-ray scattering (SAXS) was performed on all composites to measure the average NPs distribution per unit volume. Figure 9 shows SAXS curves for samples prepared with 10 mg PAE/g and different TiO2 loading (0.5–80 wt%). The SAXS curves intensity increases with the concentration of TiO2 NPs in the composites. All SAXS curves show a kink at q* = 0.035 Å−1 which divides SAXS curves into two different slope regions referred to as low and high q region (shown by dashed line).
Figure 9.
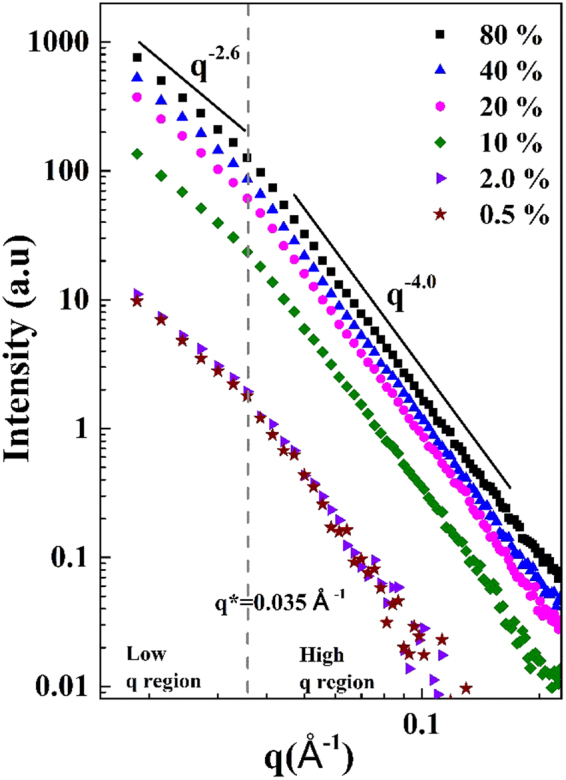
SAXS curves for the MFC/TiO2 composites with 10 mg/g of PAE and different loading of NPs from 0.5 to 80 wt%.
The slopes in SAXS curves represent the fractal dimensions at different length scales. At high q region, the slope represents the surface scattering/fractals (smoothness of surface) and at lower q values, the slope shows the scattering from aggregates/mass fractals. Slope varies as the power-law exponent (q−α) of scattering intensity. For the mass fractals, value of α lies within 0 < α < 3, and 3 < α < 4 for surface fractals49,50.
In Fig. 9, the slope in the high q region is q−4 (q* > q) which shows the surface fractal region while α = 4 reveals that the NPs surface is smooth. The slope for the low q region is q−2.6 (q* < q) and represents the mass fractal region (α = 2.6) which is interpreted as evidence of the formation of NPs aggregates51.
Discussion
Quality and durability of MFC-PAE-TiO2 composites
TiO2 paper composites of different TiO2 nanoparticles (NPs) content were prepared with two PAE dosages (10 mg and 50 mg PAE/g MFC). The photocatalytic activity was tested under standard conditions using aqueous solutions of methyl orange (MO) dye. MO is an azo dye of relatively high toxicity and poor biodegradability which provides a good reference for waste water residues from the printing and dying industries26. The effect of TiO2 NPs (30–50 nm) and their aggregates distribution as influenced by PAE was analysed by combining scanning electron microscopy (SEM), small angle X-ray scattering (SAXS) and photocatalytic kinetics. NPs aggregation is crucial as it influences the ability of the material to absorb and scatter incoming radiation, which greatly affects the photocatalytic activity52.
Here, the addition of PAE was part of the strategy to engineer paper wet strength to develop durable MFC-TiO2 composites able to sustain harsh applications in aqueous environments. PAE serves two functions. First, it cross-links cellulosic fibres, producing non-woven materials that remain durable when used wet and under long UV light exposure; second, it retains TiO2 NPs onto the MFC fibres and within the fibrous composite structure. Previous work done with PAE in cellulose paper systems has proven that an addition of 10 mg PAE/g fibre retain the wet-strength of the paper, making it water resistant42. MFC-PAE-TiO2 composites are very efficient at degrading organic dye in solution and have the sufficient wet strength to be robustly manipulated. The photocatalysis results in Fig. 2 also indicates that neither PAE nor MFC contributes to the photocatalytic activity which is solely based on the presence and distribution of TiO2.
The flexible TiO2 composite sheets investigated are simpler to produce than most methods described in literature that use dopants, carbon and other materials and tedious preparation methods26,27,33,53. The composites show excellent photocatalytic activity in degrading MO and are uniform, reproducible and re-usable (Fig. 3). In the reusability test cycles, no noticeable mass loss of TiO2 NPs or broken MFC structure was observed. The composites can easily be removed from the polluted water after the reaction is completed and are expected to be fully recyclable using current equipment and processes42. Figure 3c shows that the composites produced are reusable even after the third cycle.
TiO2 has a characteristic UV-Vis absorbance peak which depends on particle size and concentration. Anatase TiO2 absorbance occurs at wavelength range of 350–390 nm54. MO solutions were monitored through UV-Vis every 30 minutes. In this time interval, no characteristic peak between 350–390 nm was observed (Supplementary Fig. S1). This indicates that no TiO2 NPs have been desorbed and diffused from the composite into the MO solution which confirms the stability of TiO2 in the MFC matrix. Using PAE to embed TiO2 into the MFC matrix and consolidate the composite resolves the instability problems that have typically arisen from NPs alone.
Effect of PAE on TiO2 nanoparticle retention
We raised two hypotheses in this study. The first is that the distribution and aggregation of TiO2 NPs both affect the TiO2-MFC composite photocatalytic activity; the second is that PAE dosage governs the retention of TiO2 NPs. PAE adsorption onto MFC reaches the maximum capacity of adsorption at 15 mg/g (Fig. 4). This is about twice the value reported for PAE adsorption onto eucalyptus fibres (8.6 mg/g)55. Assuming MFC to be uniform cylinders of 10.37 μm long and of average diameter 73 nm56, the specific surface area of MFC is 36.5 m2/g. The surface area reported for MFC characterized through mercury porosimetry and BET are 31.1 m2/g57 and 35 m2/g58, respectively. A specific PAE adsorption of 0.41 mg/m2 results for MFC which is consistent with the range of polyelectrolyte adsorption (0.4–1 mg/m2)59.
Because of its low molecular weight (200 kDa) and chemical composition with 2 interacting functionalities (primary and secondary amines and azetidinium), PAE is expected to transfer to some extent from MFC to TiO2 upon collision60. This would result in TiO2 aggregate formation. Such TiO2 aggregates can be seen by SEM, especially at the high TiO2 loadings (Figs 7 and 8).
Adding 10 mg PAE/g saturates all MFC fibres which induces a charge reversal to +25 mV—charge of opposite sign but equivalent magnitude to the original (Fig. 5). At this dosage, all PAE is adsorbed onto MFC (Fig. 4). No excess free PAE is expected in solution. Under those conditions, all TiO2 NPs are anticipated to adsorb onto MFC with a high retention efficiency. This means that the TiO2 content on MFC fibres should increase pseudo linearly with TiO2 add-on.
At 50 mg PAE/g, all the MFC fibres are saturated with PAE and there is an important excess free PAE remaining in solution. PAE adsorbs at 15 mg/g MFC; this means 18 mg is consumed by MFC fibres, leaving 42 mg PAE in solution. Assuming PAE adsorbs onto TiO2 in the same morphology/conformation as on MFC, at 0.41 mg/m2 (specific PAE adsorption on MFC), then the free PAE in solution can cover 102 m2 of TiO2, or nearly 2.88 g of TiO2 which corresponds to 67 wt% loading in the composites. This means for TiO2 content lower than 67 wt%, all TiO2 NPs are expected to be fully covered by PAE, as are the MFC fibres to which PAE was previously adsorbed; no TiO2 retention due to electrostatic interactions is expected.
Figure 5 shows the zeta potential of +40 mV at 50 mg PAE/g of suspension. This reveals a strongly electrostatically stabilised system, and no adsorption of TiO2 onto MFC, or homocoagulation of TiO2 or MFC fibres are expected. That was not the case. SEM (Fig. 8) and photocatalysis activity (Fig. 2b) contradict this expectation. For one, TiO2 NPs and aggregates are seen by SEM to be present on MFC surfaces. Also, photocatalysis is at the highest for composites containing 20 to 80 wt% TiO2. Further, there is photocatalysis and TiO2 retention even for the very low loadings (2 to 5 wt% TiO2) for which not only are both components of the system saturated with PAE, but there is also a large excess of PAE in solution. These results state that PAE does not follow trivial polyelectrolyte adsorption behaviour. PAE very likely adsorbs as partial multilayer at very high concentrations. Adsorption isotherm was thus further quantified under the exceptional conditions of 120 mg PAE/g MFC. A slight increase in adsorption capacity was indeed recorded (Supplementary Fig. S2). PAE is known for its ability to self-cross link during drying, which suggests some ability to assemble at very high concentrations.
The PAE adsorption, TiO2 retention and TiO2 coagulation expectations from fundamental principles clearly contradict the photocatalytic, retention efficiency measurements as well as the SEM results. This means that PAE behaves differently from the trivial polyelectrolyte adsorption behaviour previously discussed.
Composites photocatalysis activity
Photocatalysis is a surface phenomenon. Only the TiO2 NPs retained on the composite external surface, which is irradiated by UV light, can take part in the photocatalysis process. At 10 mg PAE/g, all PAE is adsorbed onto MFC (Fig. 4) creating a monolayer of PAE on MFC. Since maximum adsorption results at 15 mg/g, this means that at 10 mg PAE/g some of the MFC surface is still not coated by PAE. As TiO2 NPs are added, the amount of TiO2 that can be retained on the surface for 10 mg of PAE is less than at 50 mg PAE. This can be seen by the higher retention found for the 50 mg PAE/g as compared to those made with 10 mg PAE/g (Fig. 6).
However, at 50 mg PAE/g, the entire MFC surface is completely covered by PAE and there is excess in solution. This excess PAE interacts firstly with the incoming TiO2 NPs and hinders their agglomeration into large agglomerates by electro-steric stabilisation. This increases the TiO2 surface area available for photocatalysis; this also accounts for the higher photocatalysis for composites made with 50 mg PAE/g.
Saturation of the photocatalytic activity after reaching a critical TiO2 loading (at a particular PAE dosage) might be due to the formation of large agglomerates which constrain the effective surface area available for photocatalysis. SEM showed (Fig. 7) that at 2 wt% TiO2 (10 PAE mg/g), there are less individual NPs compared to composites with 40–80 wt% TiO2.
The influence of wet strength resins on photocatalytic activity was first studied by Zhang et al. (2013) who claimed that PAE addition slightly decreased photocatalytic activity due to a reduction in TiO2 retention in paper33. This statement contradicts our results. We found that PAE helps retain more TiO2 NPs in paper (Fig. 6) which is in agreement with the SAXS results (Fig. 8). However, comparison of photocatalytic activity results is not direct nor straightforward; many variables influencing catalytic activity. This is illustrated in Table 1 which compares the photocatalytic dye degradation in aqueous solution from selected studies with TiO2/cellulose composites.
Table 1.
Literature comparison of the material performances.
| Composite type | Degrading medium | UV lamp conditions | Time taken to degrade by 90% | Reference |
|---|---|---|---|---|
| 40 wt% TiO2 nanobelt paper | Methyl Orange | 30 W, 294 nm | ~2.5 hours | 37 |
| TiO2 particle size: 21 nm | 20 mL | |||
| Test piece: 1 × 1 cm2 | 0.02 g/L | |||
| TiO2/cellulose fibre composite | Methyl Orange | 30 W | ~7 hours | 33 |
| TiO2 particle size: 25–30 nm | 20 mL | |||
| Test piece: 3 × 3 cm2 | 20 mg/L | |||
| TiO2/regenerated cellulose paper | Phenol | 6 W, 253 nm, | ~102 hours | 63 |
| Test piece: 1 × 8 cm2 | 320 mL | |||
| 67.2 mg/L | ||||
| 10 wt% TiO2/bleached softwood cellulose fibre composite | Methyl Orange | 72 W | ~13 hours | 64 |
| Test piece: 2.5 × 0.7 cm2 | 0.25 mM in 4 ml water | 320–400 nm | ||
| TiO2 nanorods/regenerated cellulose films | Methylene blue | 30 W, 312 nm | ~4 hours | 31 |
| 150 mL | ||||
| 40 mg/L |
Note: the independent variable is radiation intensity: photon per unit area per time. Geometry of the system, particularly the distance from surface and the diffusion angle, affects this a lot.
Figure 10 shows the rate constant normalized per grams of TiO2 NPs present in the composite samples tested in this study. The graph indicates that low TiO2 loadings provide the best photocatalytic activity per unit TiO2. This material performed best at 0.5–2 wt% TiO2 loading. The photocatalytic activity of the TiO2-MFC composites prepared at this work is very effective under UV irradiation; only a small amount of TiO2 is needed to effectively degrade MO.
Figure 10.
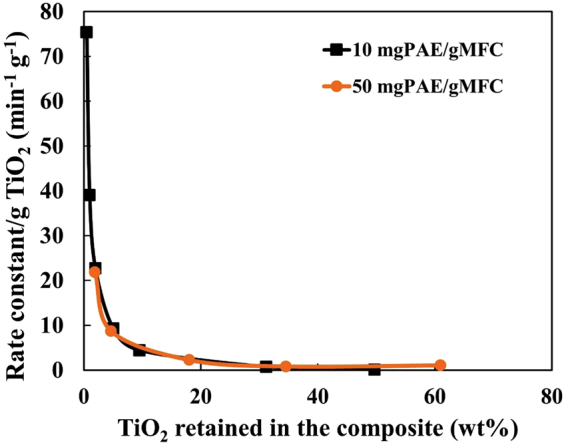
Photocatalytic performance of the material represented by plotting the variation in rate constant as function of the TiO2 amount retained in the composite.
TiO2-cellulose composites were engineered to be easy to manufacture by process straightforwardly scalable; the composites produced are water resistant, flexible, cost effective, and most importantly, reproducible. These composites are green and can be used in applications such as waste water treatment, antibacterial, drug delivery and medical61,62.
Conclusion
Water resistant microfibrillated cellulose (MFC)—polyamide-amine-epichlorohydrin (PAE)—titanium dioxide (TiO2) composites were prepared by a simple two-step process, where PAE was first added to a MFC suspension, followed by TiO2 addition. These composites are simple to prepare, economical and the process is easily scalable. Photocatalytic activity of the composites produced was tested by following the degradation of methyl orange (MO) aqueous solutions under UV irradiation. Results show that neither MFC nor PAE or their combination contributed to photocatalytic activity; only the TiO2 nanoparticles (NPs) embedded in the sheets do. TiO2 NPs are uniformly distributed within the composite sheets as shown by the excellent special repeatability in photocatalysis measured. Further, these composites are reusable; the same reproducible photocatalytic efficiency was achieved by testing a same test strip 3 times with no loss of TiO2 NPs leaching into solution.
Comparing photocatalytic activity of composites with two different dosage of PAE (10 and 50 mg PAE/g of MFC) revealed a higher activity and TiO2 NPs retention for the high PAE dosage. MO degraded to 5% of its original concentration in 180 min for composites with low PAE and 150 min for composites with high PAE. Photocatalytic is a non-monotonous function of TiO2 content. For composites made with 10 and 50 mg PAE/g and various amounts of NP, the photocatalytic activity increased up to 2 and 20 wt% TiO2 NP and remained constant thereafter. SEM indicated that at low TiO2 loading, NPs retain as individual particles on MFC, whereas TiO2 aggregates at higher loadings. SAXS showed the formation of mass fractals aggregates at different NPs loading. PAE adsorption isotherms revealed a maximum PAE adsorption on MFC (Γmax) at 15 mg/g. Expectation resulting from PAE steric and bridging mechanism with maximum coagulation at half surface coverage contradicted the TiO2 retention efficiency measurements. This suggests that PAE does not follow trivial polyelectrolyte adsorption behaviour. The current study provides a novel insight in engineering NPs embedded cellulose based biodegradable, flexible and recyclable composites with high potential for applications requiring photocatalysis without any residual contamination.
Experimental
Materials
Microfibrillated cellulose (MFC) was purchased from DAICEL Chemical Industries Limited, Japan (grade Celish KY-100G). MFC was supplied at 25 wt% solids and stored at 5oC as received. The mean diameter and the aspect ratio of MFC was 73 nm and 100–150, respectively56. Anatase titanium dioxide (TiO2) was purchased from US Research Nanomaterials, USA. The nanoparticle (NP) size ranged within 30–50 nm and was received at 40 wt% solids. The commercial polyamide-amine-epichlorohydrin (PAE) was provided by Nopco Paper Technology Pty Ltd, Australia (33 wt% solids). Methyl Orange (MO) was purchased as a powder from Sigma Aldrich.
Methods
MFC sheet preparation
MFC sheets were prepared using a standard British hand sheet maker (model T205). The hand sheet maker was equipped with a woven filter with an average opening of 74 microns. A Whatman wet strengthened filter paper (WHAT1114-185) with a pore size of 25 microns was placed on top of the woven filter and a 0.3 wt% MFC suspension (with 1.2 g dry mass of MFC) was poured into the column. Once the water drained under gravity, the wet film was taken out using blotter papers, the filter paper was removed, and the sheet was pressed at 385 kPa for 5 minutes and then dried at 105 °C using a sheet drier.
MFC-PAE-TiO2 composite sheet preparation
Two sets of MFC-PAE-TiO2 composites were produced:
Composites with low PAE dosage: 0.3 wt% MFC (1.2 g fixed), 0.01 wt% PAE (10 mg PAE/g MFC fixed) and with varying TiO2 loading at 0.5, 1, 2, 5, 10, 40 and 80 wt%.
Composites with high PAE dosage: 0.3 wt% MFC (1.2 g fixed), 0.03 wt% PAE (50 mg PAE/g MFC fixed) and with varying TiO2 loading at 2, 5, 20, 40 and 80 wt%.
The composites were prepared in a two-step process. Firstly, the PAE suspension was added at a constant flowrate of 30 mL/min into a beaker containing 0.3 wt% (1.2 g fixed) MFC, while stirring the suspension using a hand stirrer (high shear mixing). Secondly, 0.1 wt% TiO2 suspensions were strongly sonicated (sonicator model: VCX750 purchased from John Morris Scientific Pty Ltd for, used for 10 minutes at 80% amplitude) and added to the MFC-PAE suspension at a constant flowrate of 20 mL/min, while stirring the entire suspension.
Suspensions were poured into the British hand sheet maker and the composite sheets were made as described above.
Photo-degradation of methyl orange
The photocatalytic degradation tests were carried out at room temperature using MO as a model dye. A 100 W lamp (365 nm wavelength) was used as the light source. The samples were cut into 2.5 cm × 2.5 cm pieces and dispersed in a 50 mL beaker filled with 15 mL of 5 ppm pH 3 MO aqueous solution. The sample immersed in the beaker was kept in the dark for 2 hours until the maximum adsorption of MO by MFC prior to photocatalytic experiment was reached. The beaker was then subjected to UV radiation for MO photocatalytic degradation. The distance between the liquid surface and the light source was 19 cm. At given irradiation time intervals, the solution was collected for analysis using UV-vis spectroscopy (Model: Cary 60 UV-Vis, Agilent Technologies). Experimental set up is shown in Fig. 11.
Figure 11.
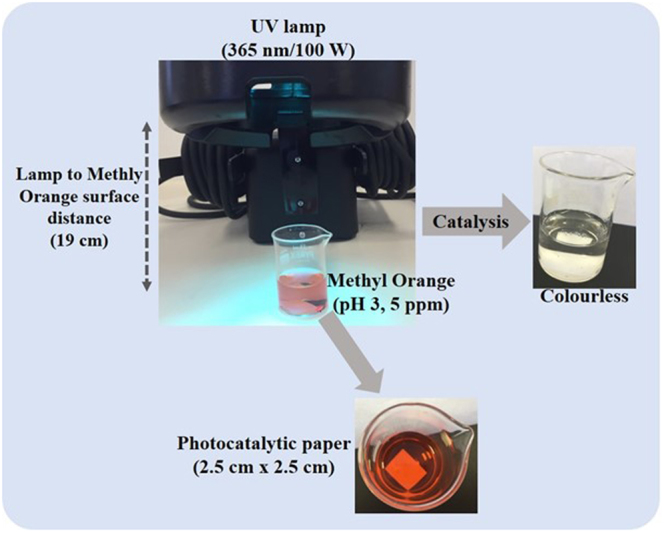
Experimental setup for photocatalytic degradation of methyl orange. The paper samples were cut to squares (2.5 cm × 2.5 cm).
Characterization
Structure and morphology study
Scanning electron microscopy (SEM) analysis of the composite sheets was performed using a FEI Magellan 400 FEGSEM. Samples were cut into 3 mm × 3 mm mounted onto a metal sample holder and coated with a thin layer of Iridium prior to imaging.
Particle and colloid charge
The zeta potential measurements of MFC, TiO2 and PAE were performed with a Nanobrook Omni (Brookhaven Instruments) in a cuvette cell at 25 °C. The zeta potential was calculated, using the supplied software, by determining electrophoretic mobility from an electrophoresis experiment using laser Doppler velocimetry and applying the Smoluchowski equation. PAE at 0.01 wt% concentration was added at different dosages to a 0.3 wt% MFC suspension and mixed using a hand stirrer for 3 minutes. MFC-PAE suspension was centrifuged at 4400 rpm for 20 minutes to remove big agglomerates and the supernatant was used to measure zeta potential.
PAE adsorption on MFC
This method is adopted, as described by Peng and Garnier48. Particle charge detector (Mutek PCD-03, BGT Instruments) was used to titrate the amount of PAE in the supernatant after centrifugation using an opposite charged polyelectrolyte until point of zero charge is met. The polyelectrolyte used was PES-Na of known concentration (0.000125 N), and was added at 10 mL dosages to the PAE-MFC supernatant. Titrant consumption was measured in mL and converted into PAE concentration through a standard curve method.
Small angle X-ray scattering (SAXS)
SAXS measurements were made on a Laboratory Bruker N8 Horizon using a CuKα (λ = 0.154 nm) micro-source. The sample to detector distance was 0.6 m covering the q range between ∼0.15 to 3.7 nm−1. The scattered photons after interacting with the sample were collected using a 2D Vantec-500 detector (pixel size ∼70 μm × 70 μm). Final scattering curves were obtained after data reduction and radial averaging using Bruker EVA software.
Electronic supplementary material
Acknowledgements
The financial support of the Australian research council, Australian paper, Carter Holt Harvey, Circa, Orora, Norske Skog and Visy through the ARC Industry Transformation Research Hub –Biomanufacturing Advanced Materials Initiative (BAMI) grant IH130100016 is acknowledged. Thanks to Monash University for MGS and FEIPRS scholarships and the MCEM centre for electron microscopy. The authors gratefully acknowledge Dr. Jisheng Ma for helping in SAXS measurements at the Bruker N8 Horizon SAXS funded from ARC LIEF LE130100072.
Author Contributions
U.G.S. and V.S.R. wrote the manuscript. U.G.S. conducted experiments on TiO2/cellulose composites sheets preparation and testing for the photo-catalytic activity. V.S.R. conducted the SAXS experiments. G.G., V.S.R., W.B. and U.G.S. were involved in the data analysis and discussions.
Competing Interests
The authors declare that they have no competing interests.
Footnotes
Electronic supplementary material
Supplementary information accompanies this paper at 10.1038/s41598-018-20569-w.
Publisher's note: Springer Nature remains neutral with regard to jurisdictional claims in published maps and institutional affiliations.
Contributor Information
Warren Batchelor, Email: warren.batchelor@monash.edu.
Gil Garnier, Email: gil.garnier@monash.edu.
References
- 1.Kemell M, Pore V, Ritala M, Leskelä M, Lindén M. Atomic layer deposition in nanometer-level replication of cellulosic substances and preparation of photocatalytic TiO2/cellulose composites. Journal of the American Chemical Society. 2005;127:14178–14179. doi: 10.1021/ja0532887. [DOI] [PubMed] [Google Scholar]
- 2.Shin Y, Bae I-T, Arey BW, Exarhos GJ. Facile stabilization of gold-silver alloy nanoparticles on cellulose nanocrystal. The Journal of Physical Chemistry C. 2008;112:4844–4848. doi: 10.1021/jp710767w. [DOI] [Google Scholar]
- 3.Liu S, et al. Fiberlike Fe2O3 macroporous nanomaterials fabricated by calcinating regenerate cellulose composite fibers. Chemistry of Materials. 2008;20:3623–3628. doi: 10.1021/cm703623v. [DOI] [Google Scholar]
- 4.Tada H, Ishida T, Takao A, Ito S. Drastic enhancement of TiO2-photocatalyzed reduction of nitrobenzene by loading Ag clusters. Langmuir. 2004;20:7898–7900. doi: 10.1021/la049167m. [DOI] [PubMed] [Google Scholar]
- 5.Maeda K, Domen K. Photocatalytic water splitting: recent progress and future challenges. The Journal of Physical Chemistry Letters. 2010;1:2655–2661. doi: 10.1021/jz1007966. [DOI] [Google Scholar]
- 6.Savage N, Diallo MS. Nanomaterials and water purification: opportunities and challenges. Journal of Nanoparticle research. 2005;7:331–342. doi: 10.1007/s11051-005-7523-5. [DOI] [Google Scholar]
- 7.Kuang D, et al. Application of highly ordered TiO2 nanotube arrays in flexible dye-sensitized solar cells. ACS nano. 2008;2:1113–1116. doi: 10.1021/nn800174y. [DOI] [PubMed] [Google Scholar]
- 8.Wang X, Yu R, Wang K, Yang G, Yu H. Facile template-induced synthesis of Ag-modified TiO2 hollow octahedra with high photocatalytic activity. Chinese Journal of Catalysis. 2015;36:1211–2218. doi: 10.1016/S1872-2067(15)60978-0. [DOI] [Google Scholar]
- 9.Dong W, Yao Y, Sun Y, Hua W, Zhuang G. Preparation of three-dimensional interconnected mesoporous anatase TiO2-SiO2 nanocomposites with high photocatalytic activities. Chinese Journal of Catalysis. 2016;37:846–854. doi: 10.1016/S1872-2067(15)61081-6. [DOI] [Google Scholar]
- 10.Levchuk I, et al. TiO2/SiO2 porous composite thin films: Role of TiO2 areal loading and modification with gold nanospheres on the photocatalytic activity. Applied Surface Science. 2016;383:367–374. doi: 10.1016/j.apsusc.2016.04.008. [DOI] [Google Scholar]
- 11.Wu F, et al. Enhanced photocatalytic degradation and adsorption of methylene blue via TiO2 nanocrystals supported on graphene-like bamboo charcoal. Applied Surface Science. 2015;358:425–435. doi: 10.1016/j.apsusc.2015.08.161. [DOI] [Google Scholar]
- 12.Hu M, Cao Y, Li Z, Yang S, Xing Z. Ti3+ self-doped mesoporous black TiO2/SiO2 nanocomposite as remarkable visible light photocatalyst. Applied Surface Science. 2017;426:734–744. doi: 10.1016/j.apsusc.2017.07.178. [DOI] [Google Scholar]
- 13.Wen J, et al. Photocatalysis fundamentals and surface modification of TiO2 nanomaterials. Chinese Journal of Catalysis. 2015;36:2049–2070. doi: 10.1016/S1872-2067(15)60999-8. [DOI] [Google Scholar]
- 14.Zhao Z-J, et al. Three-dimensional plasmonic Ag/TiO2 nanocomposite architectures on flexible substrates for visible-light photocatalytic activity. Scientific Reports. 2017;7:8915. doi: 10.1038/s41598-017-09401-z. [DOI] [PMC free article] [PubMed] [Google Scholar]
- 15.Yang L, Gao Y, Wang F, Liu P, Hu S. Enhanced photocatalytic performance of cementitious material with TiO2@Ag modified fly ash micro-aggregates. Chinese Journal of Catalysis. 2017;38:357–364. doi: 10.1016/S1872-2067(16)62590-1. [DOI] [Google Scholar]
- 16.Zhang L, et al. Cu2S-Cu-TiO2 mesoporous carbon composites for the degradation of high concentration of methyl orange under visible light. Applied Surface Science. 2017;422:1093–1101. doi: 10.1016/j.apsusc.2017.05.100. [DOI] [Google Scholar]
- 17.Fujishima A, Honda K. Electrochemical photolysis of water at a semiconductor electrode. nature. 1972;238:37–38. doi: 10.1038/238037a0. [DOI] [PubMed] [Google Scholar]
- 18.Hashimoto K, et al. Photocatalytic oxidation of nitrogen oxide over titania–zeolite composite catalyst to remove nitrogen oxides in the atmosphere. Applied Catalysis B: Environmental. 2001;30:429–436. doi: 10.1016/S0926-3373(00)00258-7. [DOI] [Google Scholar]
- 19.Manassah, J. Treatment of highly polluted paper mill waste water by solar photocatalytic oxidation with synthesized nano Tio2. 2011 International Conference on Green Technology and Environmental Conservation (GTEC 2011) India. Chennai, 10.1109/GTEC.2011.6167693. IEEE. 12 March 2012.
- 20.Wei F, Zeng H, Cui P, Peng S, Cheng T. Various TiO2 microcrystals: controlled synthesis and enhanced photocatalytic activities. Chemical Engineering Journal. 2008;144:119–123. doi: 10.1016/j.cej.2008.06.015. [DOI] [Google Scholar]
- 21.Serpone N, Emeline A. Suggested terms and definitions in photocatalysis and radiocatalysis. International Journal of Photoenergy. 2002;4:91–131. doi: 10.1155/S1110662X02000144. [DOI] [Google Scholar]
- 22.Nimlos MR, Jacoby WA, Blake DM, Milne TA. Direct mass spectrometric studies of the destruction of hazardous wastes. 2. Gas-phase photocatalytic oxidation of trichloroethylene over titanium oxide: products and mechanisms. Environmental science & technology. 1993;27:732–740. doi: 10.1021/es00041a018. [DOI] [Google Scholar]
- 23.Fujishima A, Rao TN, Tryk DA. Titanium dioxide photocatalysis. Journal of Photochemistry and Photobiology C: Photochemistry Reviews. 2000;1:1–21. doi: 10.1016/S1389-5567(00)00002-2. [DOI] [Google Scholar]
- 24.Zhang H, et al. A facile one-step synthesis of TiO2/graphene composites for photodegradation of methyl orange. Nano Research. 2011;4:274–283. doi: 10.1007/s12274-010-0079-4. [DOI] [Google Scholar]
- 25.Mandzy N, Grulke E, Druffel T. Breakage of TiO2 agglomerates in electrostatically stabilized aqueous dispersions. Powder technology. 2005;160:121–126. doi: 10.1016/j.powtec.2005.08.020. [DOI] [Google Scholar]
- 26.Zhang X, Chen W, Lin Z, Yao J, Tan S. Preparation and photocatalysis properties of bacterial cellulose/TiO2 composite membrane doped with rare earth elements. Synthesis and Reactivity in Inorganic, Metal-Organic, and Nano-Metal Chemistry. 2011;41:997–1004. doi: 10.1080/15533174.2011.591334. [DOI] [Google Scholar]
- 27.Li G, et al. Laccase-immobilized bacterial cellulose/TiO2 functionalized composite membranes: Evaluation for photo-and bio-catalytic dye degradation. Journal of Membrane Science. 2017;525:89–98. doi: 10.1016/j.memsci.2016.10.033. [DOI] [Google Scholar]
- 28.Alrousan DM, Dunlop PS, McMurray TA, Byrne JA. Photocatalytic inactivation of E. coli in surface water using immobilised nanoparticle TiO2 films. Water research. 2009;43:47–54. doi: 10.1016/j.watres.2008.10.015. [DOI] [PubMed] [Google Scholar]
- 29.Long TC, Saleh N, Tilton RD, Lowry GV, Veronesi B. Titanium dioxide (P25) produces reactive oxygen species in immortalized brain microglia (BV2): implications for nanoparticle neurotoxicity. Environmental Science & Technology. 2006;40:4346–4352. doi: 10.1021/es060589n. [DOI] [PubMed] [Google Scholar]
- 30.Lovern SB, Strickler JR, Klaper R. Behavioral and physiological changes in Daphnia magna when exposed to nanoparticle suspensions (titanium dioxide, nano-C60, and C60HxC70Hx) Environmental science & technology. 2007;41:4465–4470. doi: 10.1021/es062146p. [DOI] [PMC free article] [PubMed] [Google Scholar]
- 31.Mohamed MA, et al. Incorporation of N-doped TiO2 nanorods in regenerated cellulose thin films fabricated from recycled newspaper as a green portable photocatalyst. Carbohydrate polymers. 2015;133:429–437. doi: 10.1016/j.carbpol.2015.07.057. [DOI] [PubMed] [Google Scholar]
- 32.Snyder A, Bo Z, Moon R, Rochet J-C, Stanciu L. Reusable photocatalytic titanium dioxide–cellulose nanofiber films. Journal of colloid and interface science. 2013;399:92–98. doi: 10.1016/j.jcis.2013.02.035. [DOI] [PubMed] [Google Scholar]
- 33.Zhang J, Liu W, Wang P, Qian K. Photocatalytic behavior of cellulose-based paper with TiO2 loaded on carbon fibers. Journal of Environmental Chemical Engineering. 2013;1:175–182. doi: 10.1016/j.jece.2013.04.022. [DOI] [Google Scholar]
- 34.Shi J, Zheng J, Wu P, Ji X. Immobilization of TiO2 films on activated carbon fiber and their photocatalytic degradation properties for dye compounds with different molecular size. Catalysis Communications. 2008;9:1846–1850. doi: 10.1016/j.catcom.2008.02.018. [DOI] [Google Scholar]
- 35.Ochiai T, et al. Fabrication of a TiO2 nanoparticles impregnated titanium mesh filter and its application for environmental purification. Catalysis Science & Technology. 2011;1:1324–1327. doi: 10.1039/c1cy00185j. [DOI] [Google Scholar]
- 36.Li J, Chen C, Zhao J, Zhu H, Orthman J. Photodegradation of dye pollutants on TiO2 nanoparticles dispersed in silicate under UV–VIS irradiation. Applied Catalysis B: Environmental. 2002;37:331–338. doi: 10.1016/S0926-3373(02)00011-5. [DOI] [Google Scholar]
- 37.Wang J, et al. Preparation of cellulose fiber–TiO2 nanobelt–silver nanoparticle hierarchically structured hybrid paper and its photocatalytic and antibacterial properties. Chemical engineering journal. 2013;228:272–280. doi: 10.1016/j.cej.2013.04.098. [DOI] [Google Scholar]
- 38.Garusinghe UM, et al. Assembly of nanoparticles-polyelectrolyte complexes in nanofiber cellulose structures. Colloids and Surfaces A: Physicochemical and Engineering Aspects. 2017;513:373–379. doi: 10.1016/j.colsurfa.2016.10.068. [DOI] [Google Scholar]
- 39.Li S, Huang J. Cellulose‐Rich Nanofiber‐Based Functional Nanoarchitectures. Advanced Materials. 2016;28:1143–1158. doi: 10.1002/adma.201501878. [DOI] [PubMed] [Google Scholar]
- 40.Hoeng F, Denneulin A, Bras J. Use of nanocellulose in printed electronics: a review. Nanoscale. 2016;8:13131–13154. doi: 10.1039/C6NR03054H. [DOI] [PubMed] [Google Scholar]
- 41.Ngo YH, Li D, Simon GP, Garnier G. Paper surfaces functionalized by nanoparticles. Advances in colloid and interface science. 2011;163:23–38. doi: 10.1016/j.cis.2011.01.004. [DOI] [PubMed] [Google Scholar]
- 42.Su J, Mosse WK, Sharman S, Batchelor W, Garnier G. Paper strength development and recyclability with polyamideamine-epichlorohydrin (PAE) BioResources. 2012;7:0913–0924. doi: 10.15376/biores.7.2.2141-2155. [DOI] [Google Scholar]
- 43.Varanasi S, Batchelor W. Superior non-woven sheet forming characteristics of low-density cationic polymer-cellulose nanofibre colloids. Cellulose. 2014;21:3541–3550. doi: 10.1007/s10570-014-0370-8. [DOI] [Google Scholar]
- 44.Garusinghe, U. M., Varanasi, S., Garnier, G. & Batchelor, W. Strong cellulose nanofibre–nanosilica composites with controllable pore structure. Cellulose24, 2511–2521 (2017).
- 45.Raghuwanshi VS, Garusinghe UM, Ilavsky J, Batchelor WJ, Garnier G. Effect of nanoparticles size and polyelectrolyte on nanoparticles aggregation in a cellulose fibrous matrix. Journal of Colloid and Interface Science. 2018;510:190–198. doi: 10.1016/j.jcis.2017.09.064. [DOI] [PubMed] [Google Scholar]
- 46.Obokata T, Isogai A. The mechanism of wet-strength development of cellulose sheets prepared with polyamideamine-epichlorohydrin (PAE) resin. Colloids and Surfaces A: Physicochemical and Engineering Aspects. 2007;302:525–531. doi: 10.1016/j.colsurfa.2007.03.025. [DOI] [Google Scholar]
- 47.Raj P, et al. Effect of polyelectrolyte morphology and adsorption on the mechanism of nanocellulose flocculation. Journal of colloid and interface science. 2016;481:158–167. doi: 10.1016/j.jcis.2016.07.048. [DOI] [PubMed] [Google Scholar]
- 48.Peng P, Garnier G. Effect of cationic polyacrylamide adsorption kinetics and ionic strength on precipitated calcium carbonate flocculation. Langmuir. 2010;26:16949–16957. doi: 10.1021/la103410j. [DOI] [PubMed] [Google Scholar]
- 49.Cherny AY, Anitas E, Osipov V, Kuklin A. Small-angle scattering from multiphase fractals. Journal of Applied Crystallography. 2014;47:198–206. doi: 10.1107/S1600576713029956. [DOI] [Google Scholar]
- 50.Rieker TP, Hindermann-Bischoff M, Ehrburger-Dolle F. Small-angle X-ray scattering study of the morphology of carbon black mass fractal aggregates in polymeric composites. Langmuir. 2000;16:5588–5592. doi: 10.1021/la991636a. [DOI] [Google Scholar]
- 51.Beaucage G. Small-angle scattering from polymeric mass fractals of arbitrary mass-fractal dimension. Journal of Applied Crystallography. 1996;29:134–146. doi: 10.1107/S0021889895011605. [DOI] [Google Scholar]
- 52.Pellegrino F, et al. Influence of Agglomeration and Aggregation on the Photocatalytic Activity of TiO2 Nanoparticles. Applied Catalysis B: Environmental216, 80–87(2017).
- 53.An X, et al. Synthesis of nano-fibrillated cellulose/magnetite/titanium dioxide (NFC@ Fe 3 O 4@ TNP) nanocomposites and their application in the photocatalytic hydrogen generation. Applied Catalysis B: Environmental. 2017;206:53–64. doi: 10.1016/j.apcatb.2017.01.021. [DOI] [Google Scholar]
- 54.Weng C-C, Wei K-H. Selective distribution of surface-modified TiO2 nanoparticles in polystyrene-b-poly (methyl methacrylate) diblock copolymer. Chemistry of materials. 2003;15:2936–2941. doi: 10.1021/cm0300617. [DOI] [Google Scholar]
- 55.Huang, Z., Gengenbach, T., Tian, J., Shen, W. & Garnier, G. The role of polyaminoamide-epichlorohydrin (PAE) on antibody longevity in bioactive paper. Colloids and Surfaces B: Biointerfaces158, 197–202 (2017). [DOI] [PubMed]
- 56.Varanasi S, He R, Batchelor W. Estimation of cellulose nanofibre aspect ratio from measurements of fibre suspension gel point. Cellulose. 2013;20:1885–1896. doi: 10.1007/s10570-013-9972-9. [DOI] [Google Scholar]
- 57.Raj P, Varanasi S, Batchelor W, Garnier G. Effect of cationic polyacrylamide on the processing and properties of nanocellulose films. Journal of colloid and interface science. 2015;447:113–119. doi: 10.1016/j.jcis.2015.01.019. [DOI] [PubMed] [Google Scholar]
- 58.Sehaqui, H., Salajkova, M., Zhou, Q. & Berglund, L. A. Biomimetic aerogels from microfibrillated cellulose and xyloglucan. 17th International Conference on Composite Materials. (Edinburgh, United Kingdom. ICCM. July 27–31, 2009).
- 59.Fleer, G., Stuart, M. C., Scheutjens, J., Cosgrove, T. & Vincent, B. Polymers at interfaces. (ed (eds). Chapman & Hall 1993).
- 60.Asselman T, Garnier G. Mechanism of polyelectrolyte transfer during heteroflocculation. Langmuir. 2000;16:4871–4876. doi: 10.1021/la991479f. [DOI] [Google Scholar]
- 61.Galkina O, Ivanov V, Agafonov A, Seisenbaeva G, Kessler V. Cellulose nanofiber–titania nanocomposites as potential drug delivery systems for dermal applications. Journal of Materials Chemistry B. 2015;3:1688–1698. doi: 10.1039/C4TB01823K. [DOI] [PubMed] [Google Scholar]
- 62.Galkina O, et al. Antibacterial and photochemical properties of cellulose nanofiber–titania nanocomposites loaded with two different types of antibiotic medicines. Journal of Materials Chemistry B. 2015;3:7125–7134. doi: 10.1039/C5TB01382H. [DOI] [PubMed] [Google Scholar]
- 63.Zeng J, Liu S, Cai J, Zhang L. TiO2 immobilized in cellulose matrix for photocatalytic degradation of phenol under weak UV light irradiation. The Journal of Physical Chemistry C. 2010;114:7806–7811. doi: 10.1021/jp1005617. [DOI] [Google Scholar]
- 64.Chauhan I, Mohanty P. In situ decoration of TiO2 nanoparticles on the surface of cellulose fibers and study of their photocatalytic and antibacterial activities. Cellulose. 2015;22:507–519. doi: 10.1007/s10570-014-0480-3. [DOI] [Google Scholar]
Associated Data
This section collects any data citations, data availability statements, or supplementary materials included in this article.


