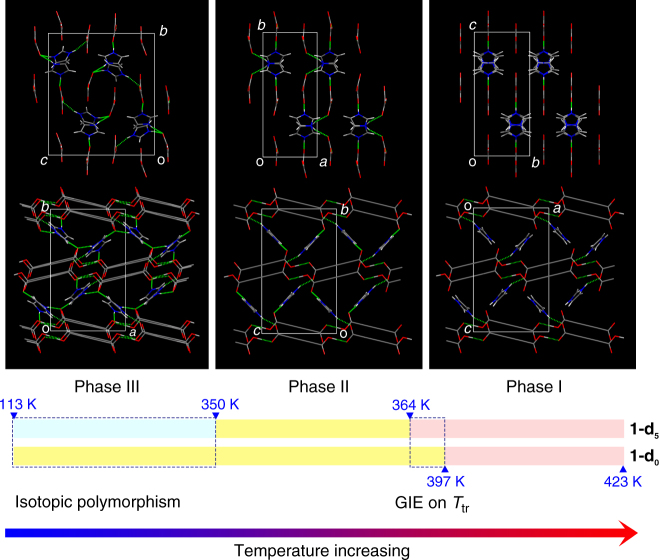
Fig. 4.
Structures of the different phases. Variation in the H-bonding networks in the three phases (phase I, light pink; phase II, yellow; phase III, light cyan), shown in a front view (upper row) and cross-sectional view (lower row) to the host channel. 1-d0 and 1-d5 are selected to represent the H and D isomorphs, respectively. The benzene ring in TPA is schematically drawn as a long C–C single bond for clarity. Red: O; blue: N; gray: C; light gray: H/D. The H bonds are represented as dotted lines. Isotopic polymorphism occurs below 350 K (phase III). The difference in the I–II phase transitions between 1-d0 and 1-d5 reveals the H/D isotope effect on Ttr (a downward shift of approximately 33 K). Note: the temperature ranges are schematically illustrated

