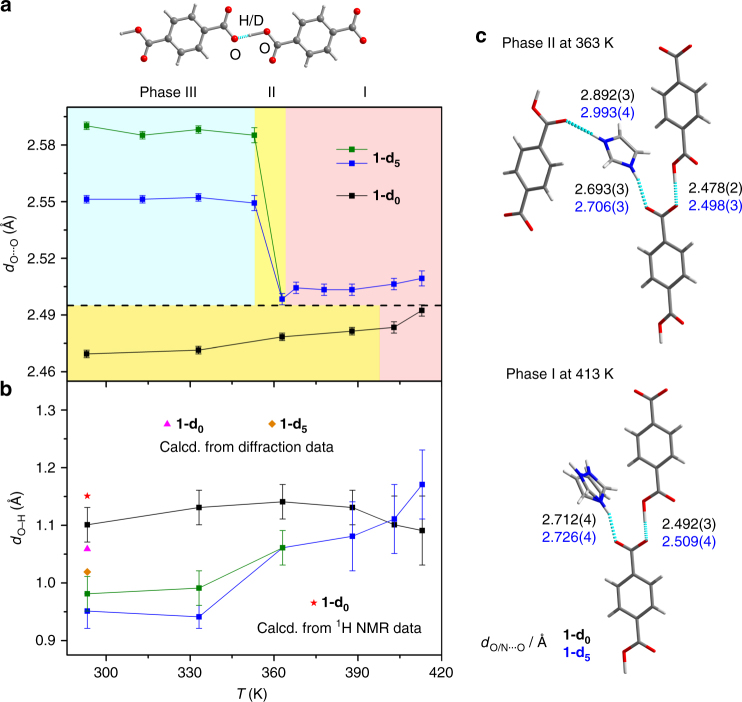
Fig. 5.
GIEs on the O–H···O H bonds between two TPA anions in different phases of 1-d0 and 1-d5. a Secondary GIE on the O···O distance (dO···O) (phase I, light pink; phase II, yellow; phase III, light cyan). Lines are placed to guide the eye. b Primary GIE on the O–H bond length (dO–H). The measured diffraction data are compared with the calculated values from either the diffraction data or the 1H NMR data at 293 K, based on the equations and parameters published by Limbach et al43. The error bars in a and b are the estimated standard deviations (esds) calculated rigorously from the full covariance matrix. The esds in the bond lengths output by SHELXL take the errors in the unit-cell dimensions into account. c Local H-bonded configurations of 1-d0 and 1-d5 in phase I (413 K) and II (363 K). Only the dO/N···O values are shown (black for 1-d0 and blue for 1-d5)

