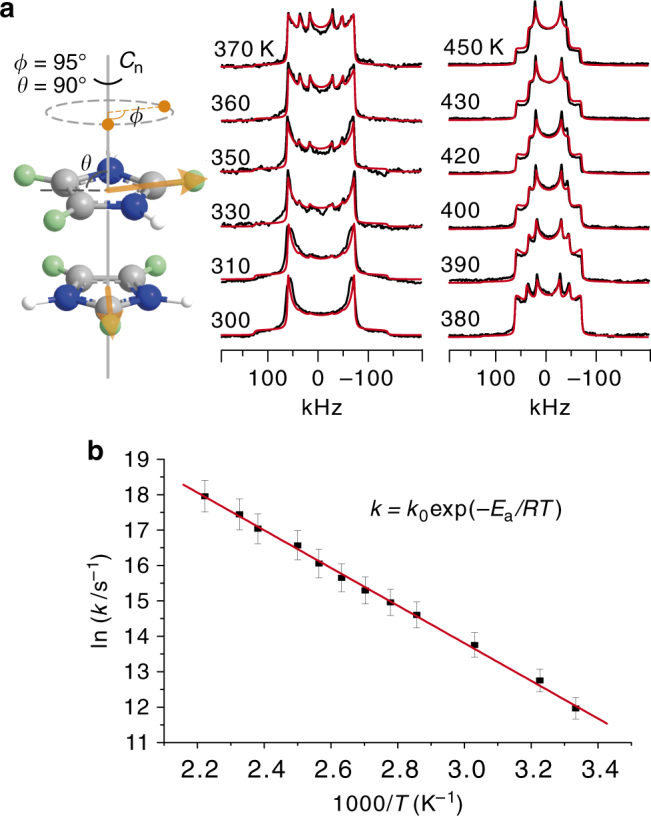
Fig. 6.

Solid-state 2H NMR spectra and analysis. a Simulated (red) and experimental (black) 2H NMR patterns of 1-d3. The experimental temperature varies from 300 to 450 K. The cartoon illustrates the in-plane reorientation motion of the Im cation. A two-site jump motion model is used for the 2H pattern simulation (see the cartoon in a), in which ϕ is the jump angle, that is, the reorientation angle, and θ is the angle between the “rotation” axis Cn and the visual plane containing the Im ring. The two orange points are the two jump sites of a specific deuterium atom in the visual plane. In the simulation, a rigid signal component has been added to the simulated patterns. b Arrhenius plot of the reorientation rates, k, were obtained from the simulated 2H NMR spectra via Weblab (http://weblab.mpip-mainz.mpg.de/weblab). The error bars represent an uncertainty of 5% of the jump/reorientation rates from the pattern simulation
