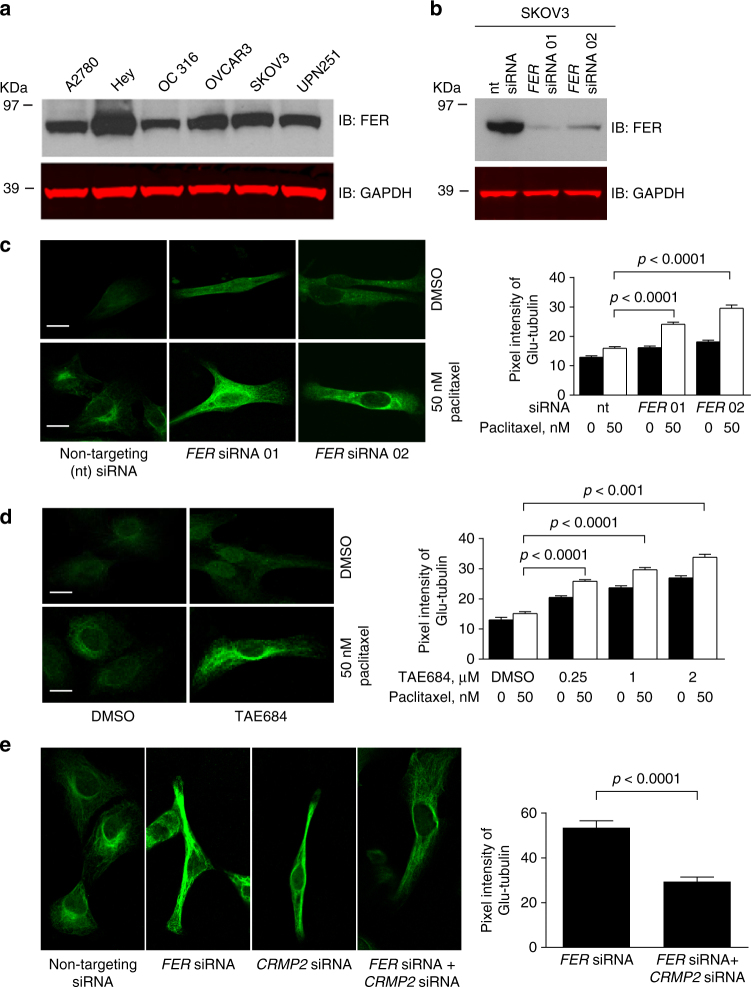
Fig. 5.
FER regulates microtubule stability through CRMP2 in ovarian cancer cells. a Western immunoblot (IB) analysis for FER expression in multiple ovarian cancer cell lines using the indicated antibodies. b Western blot analysis for FER expression in SKOV3 cells, which were transfected with non-targeting (nt) siRNA, FER siRNA 01, or FER siRNA 02. Total cell lysates were analyzed by SDS-PAGE and immunoblotted using the indicated antibodies. c Immunofluorescence staining for Glu-tubulin in SKOV3 cells, which were transfected with non-targeting (nt) siRNA, FER siRNA 01, or FER siRNA 02. Cells were treated with 50 nM paclitaxel or DMSO for 4 h before fixation. Bar plots represent the mean + s.e.m. of pixel fluorescence intensity values from at least 100 cells per condition tested, shown is a typical result from at least three independent replicates. Scale bar is 10 µm. d Immunofluorescence staining for Glu-tubulin in SKOV3 cells, which were treated with increasing concentrations of TAE684 overnight. Cells were treated with 50 nM paclitaxel or DMSO for 4 h before fixation and staining. Bar plots represent mean + s.e.m. of pixel fluorescence intensity values from at least 100 cells per condition tested, shown are typical results from at least three independent replicates. Scale bar is 10 µm. e Immunofluorescence staining for Glu-tubulin in SKOV3 cells, which were transfected with FER siRNA, CRMP2 siRNA or both. Cells were treated with 50 nM paclitaxel or DMSO for 4 h before being fixed using 4% paraformaldehyde. Bar plots are shown as mean + s.e.m. of pixel fluorescence intensity values from at least 100 cells per condition tested, shown are typical results from at least three independent replicates. Scale bar is 10 µm

