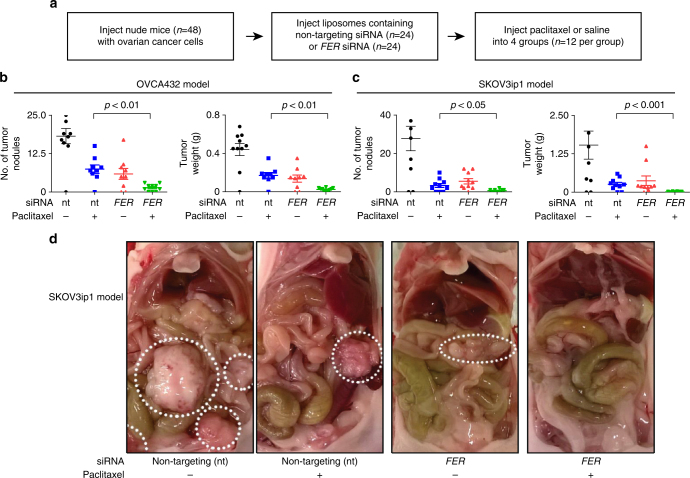
Fig. 6.
FER depletion enhances paclitaxel response in vivo. a Schematic representation of the design of the in vivo experiments. b, c Quantification analysis of the number of tumor nodules or tumor weight in the OVCA432 tumor cell model (b) and in the SKOV3ip1 tumor cell model (c). Bar plots represent the mean + s.e.m. for the number of tumor nodules and weight as indicated. d Representative images of tumor size for the SKOV3ip1 tumor cell model. The circles indicate the observed tumors

